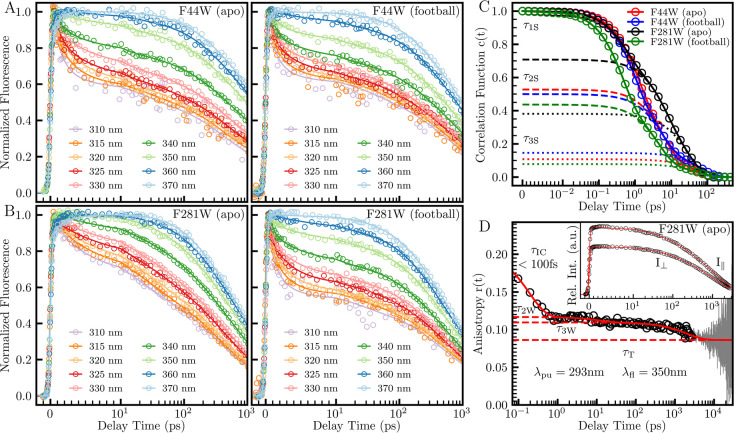
Figure 2.
Normalized fluorescence transients with correlation functions and example of anisotropy transients with calculated anisotropy. (A and B) Normalized fluorescence transient data (circles) with fit lines for the mutations F44W and F281W in each state. (C) Solvation correlation functions calculated from the transients of A and B. The dashed and dotted lines represent components of the correlation functions. (D) Apo F281W upconversion anisotropy data (circles), long-time TCSPC data (gray), and fit line (red) with associated upconversion transients in the inset.

