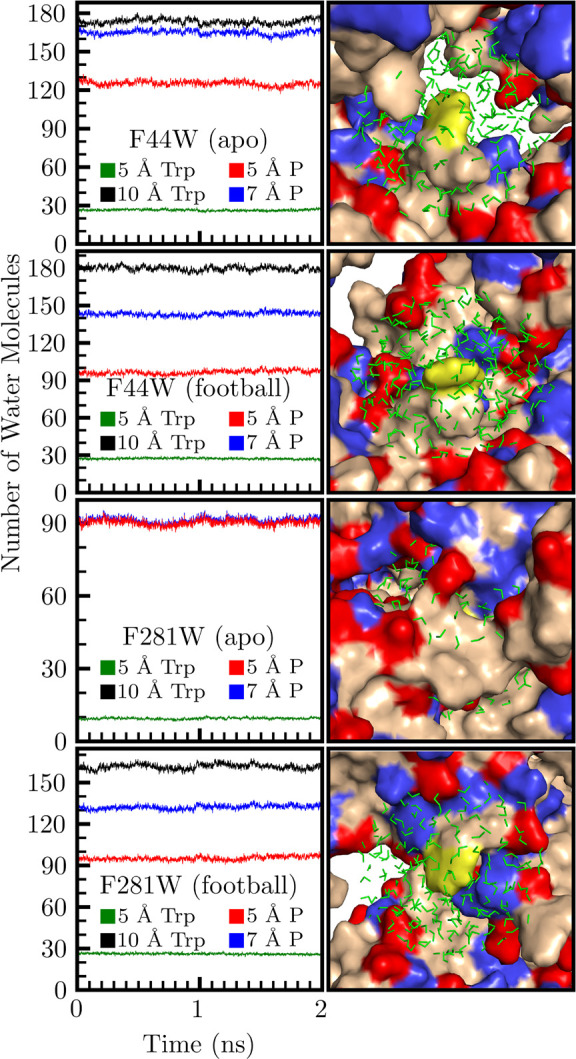
Figure 3.

Two nanosecond snapshots of an MD-simulation trajectory. The left column contains the number of water molecules within 10 Å of the tryptophan probe (black) and various subpopulations, averaged across all 14 monomer sites. The water within 5 and 7 Å from any protein surface are in red and blue, respectively. The water 5 Å from the indole ring is labeled in green. The right column contains the local environment around the tryptophan probe (yellow) with positive and negative side chains colored as blue and red, respectively. Water molecules within 10 Å of the indole ring are shown.
