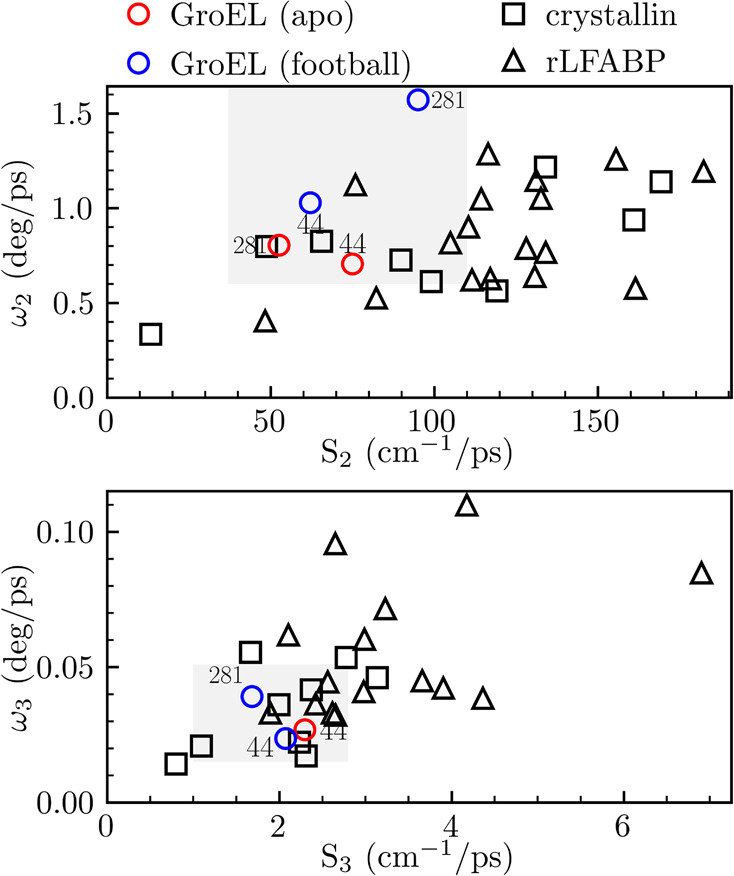
Figure 4.

Correlations of anisotropy speed (ω) and solvation speed (S) for the components in a few and tens of picoseconds. The values are compared with measurements from two previous systems, Crystallin (square) and rLFABP (triangle). The results in this Letter are represented as red (apo) and blue (football) circles. Note that F281W apo is not shown on the bottom plot because of quenching at this site (Table 1).
