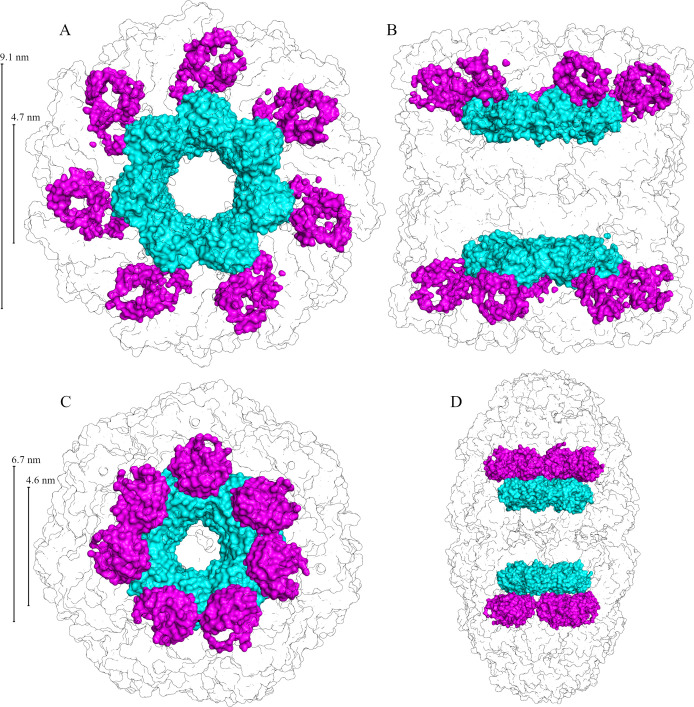
Figure 5.
Surface representation of local water probed by tryptophan with protein outline. The top row [A and B] shows the apo state, and the bottom row [C and D] shows the football state. The left column [A and C] shows a top view from the protein exterior, and the right column [B and D] shows a 90° rotation side view. Water probed by the F44W mutant is colored in cyan, and water probed by the F281W mutant is shown in pink.

