
FIGURE 4.
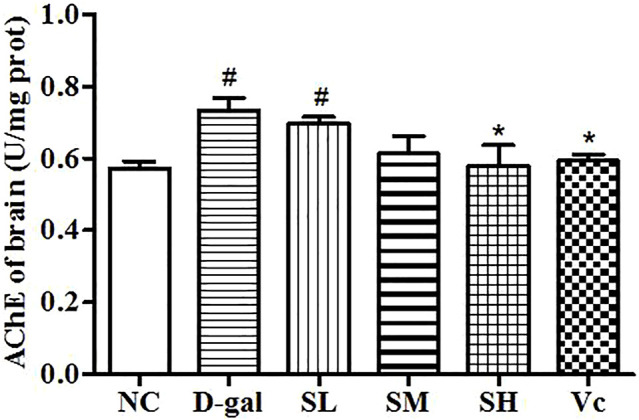
Activity of AChE in mice brain. Compared with normal group, #: p < 0.05; Compared with D–gal group, *: p < 0.05. NC: normal control group; D–gal: D–gal model group; SL: low–dose SDE group; SM: medium–dose SDE group; SL: high–dose SDE group; Vc: Vc positive control group.