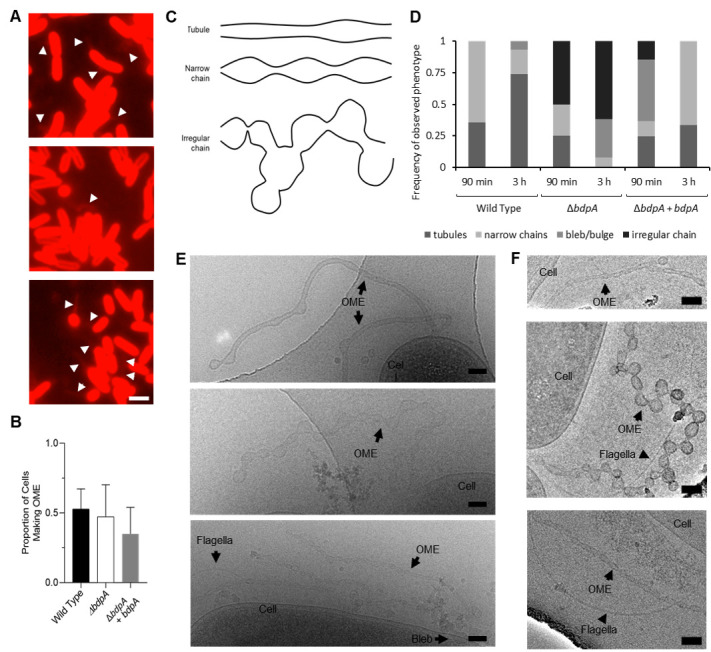
Figure 3. BdpA promotes outer membrane extension (OME) maturation into ordered tubules.

(A) Fluorescence images of Shewanella oneidensis wild-type (WT) (top), ΔbdpA (middle), and ΔbdpA+ bdpA with 12.5 µM DAPG (bottom) OMEs. Scale = 2 µm. All cells were counted manually and categorized as either with extension or without extension (a total of 2444 cells from WT, 4378 cells from ΔbdpA, and 3354 cells from ΔbdpA+ bdpA). (B) Proportion of cells making OMEs relative to the total number of cells counted from static cultures at 3 hr post-deposition onto chambered cover glass, recorded from five random fields of view from fluorescence microscopy for each of three independent cultures per strain. Statistical significance was determined by Student’s t-test (p > 0.05 for each). Error bars represent standard deviation. (C) Representative cartoon of OME phenotypes used for classification at 3 hr. (D) Frequency of OME phenotypes observed with cryogenic transmission electron microscopy (cryo-TEM) relative to the total number of OMEs observed from each strain. Phenotypes were documented from observations of 14 WT, 12 ΔbdpA, and 41 ΔbdpA+ bdpA OMEs at the 90 min time point, and 31 WT, 13 ΔbdpA, and 3 ΔbdpA+ bdpA OMEs at the 3 hr time point across three separate biological replicates, with two technical replicates of each strain per biological replicate. Membrane blebs/bulges were defined as non-structured membrane protrusions that did not resemble either of the other OME categories depicted in (E). (E) Representative cryo-TEM of S. oneidensis WT (top), ΔbdpA (middle), and ΔbdpA+ bdpA with 12.5 µM DAPG (bottom) OMEs at 90 min post-surface attachment. Scale = 100 nm. (F) Representative cryo-TEM images of WT (top), ΔbdpA (middle), and ΔbdpA+ bdpA with 12.5 µM DAPG (bottom) OMEs at 3 hr post-surface attachment. Scale = 100 nm.
