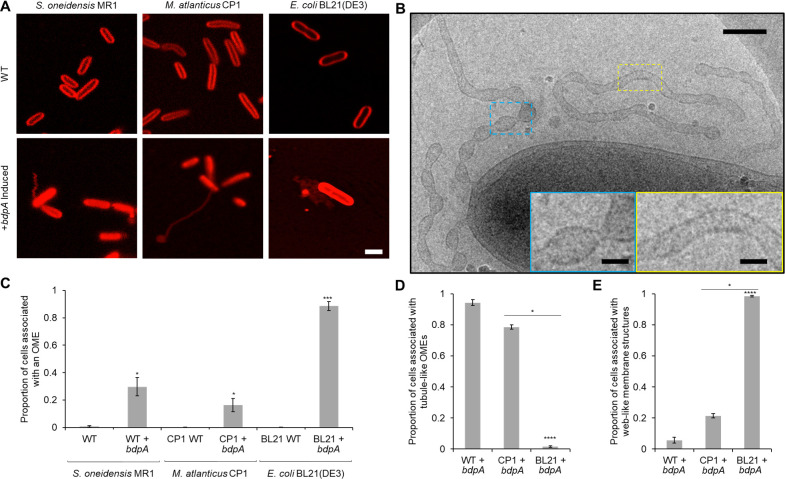
Figure 4. Heterologous expression of BdpA promotes outer membrane extension (OME) formation.
(A) Induction (1 hr) of BdpA expression with 12.5 µM DAPG during planktonic, non-attached growth results in OME formation in Shewanella oneidensis (left, wild type [WT] + bdpA), Marinobacter atlanticus CP1 (middle, CP1+ bdpA), and Escherichia coli BL21(DE3) (right, BL21+ bdpA). Scale = 2 µm. At least three individual biological replicates were included per strain and images are representative of 5–15 fields of view per replicate. (B) Cryogenic transmission electron microscopy (cryo-TEM) image of OMEs following a 2 hr planktonic induction of BdpA expression in S. oneidensis WT + bdpA cells. Scale = 200 nm. Insets enlarged to show detail of regularly ordered electron densities at the surface of OME junctions (blue) and tubule regions (yellow). Scale = 50 nm. (C) Quantification of the proportion of cells associated with an OME from 1 hr planktonic induction cultures observed across 5–10 fields of view and three individual biological replicates from S. oneidensis WT (700 cells) and WT + bdpA (472 cells) (p = 0.025), M. atlanticus CP1 (4041 cells) and CP1+ bdpA (150 cells) (p = 0.041), and E. coli BL21 WT (2190 cells) and BL21+ bdpA (2623 cells) (p = 0.0007). Asterisks denote statistical significance between OME proportions of the WT and+ bdpA samples of the same species. No significance was observed between WT + bdpA and CP1+ bdpA (p = 0.089), but BL21+ bdpA produced more OMEs than either WT + bdpA (p = 0.0017) or CP1+ bdpA (p = 0.0001). (D) Proportion of the cells associated with a tubule-like OME relative to the total number of OME-associated cells observed for each+ bdpA strain. S. oneidensis WT + bdpA produced significantly more tubule-like OMEs than E. coli BL21+ bdpA cultures (p = 1.1 × 10⁻⁵) but not M. atlanticus CP1+ bdpA (p > 0.05). Similarly, more tubule-like OMEs were observed from M. atlanticus CP1+ bdpA cultures than in E. coli BL21+ bdpA (p = 0.035). (E) Proportion of the total number of OME-associated cells in each strain observed in contact with a web-like OME. E. coli BL21+ bdpA produced predominately web-like OMEs, and significantly more than S. oneidensis WT + bdpA (p = 1.1 × 10⁻⁵) or M. atlanticus CP1+ bdpA (p = 0.035). All statistical significance was determined by Welch’s t-test. Error bars represent standard deviation.


