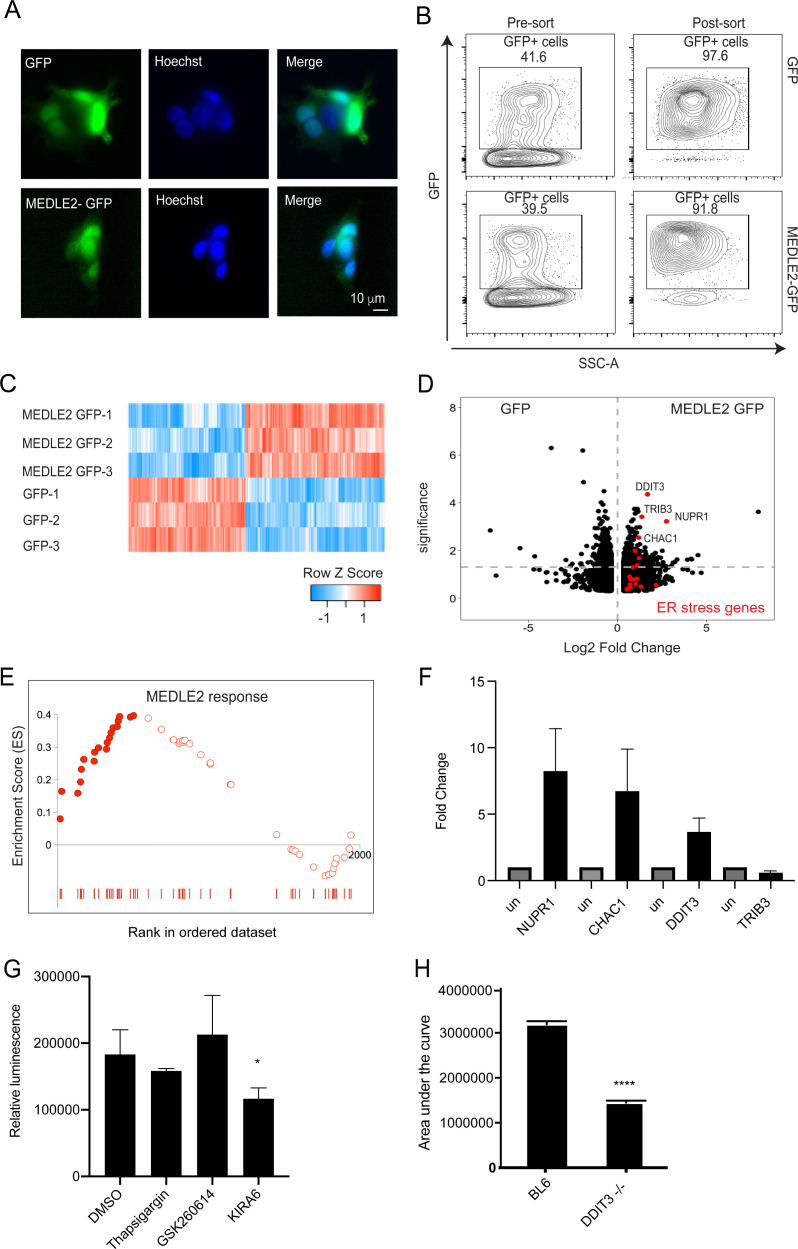
Figure 6. MEDLE2-expressing cells exhibit upregulation of genes involved in the unfolded protein response.
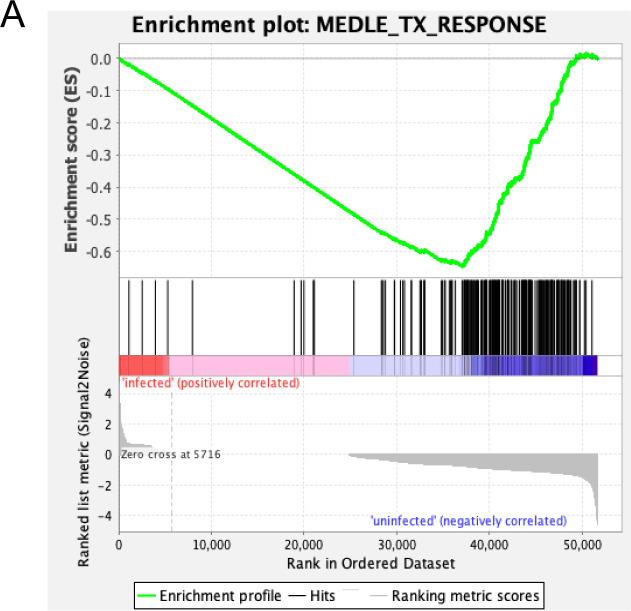
(A) HEK293T cells were transfected with plasmids encoding MEDLE2-GFP or GFP alone. After 24 hr, cells were fixed and processed for immunofluorescence assay (IFA). GFP is shown in green, Hoechst in blue. (B) 24 hr post transection, HEK293T cells were trypsinized and double sorted for live, GFP+ singlets directly into RNA lysis buffer and subjected to RNA sequencing. (C) Heat map depicting the differential gene expression between MEDLE2-GFP (top panel) and GFP control expressing cells (bottom panel). Upregulated gene expression is shown in red (row Z score > 0), while blue shows genes that are downregulated in expression (row Z score < 0). Expressing cells compared to GFP control cells. 413 transcripts showed upregulation in MEDLE2-GFP-expressing cells (right) and 487 genes had lower transcript abundance (left). The horizontal dashed line indicates p-value = 0.05. Gene set enrichment analysis (GSEA) performed on the 900 differentially expressed genes from the MEDLE2 transfection dataset identifies core enrichment of 20 genes that belong to ER stress response signaling pathways, which are indicated on the volcano plot in red. The most upregulated genes are identified by their gene ID. (E) The 234 genes with the greatest differential expression (p<0.01, log fold change absolute value > 1.5) were used to define a MEDLE2 gene set from the MEDLE2-GFP transfection dataset. This signature was used to perform GSEA using data from single-cell RNA sequencing on C. parvum-infected organoid-derived cultures, which showed enrichment of 51 genes with 22 genes in the core enrichment for the MEDLE2 response set highlighted in solid red. We note that we did not detect the MEDLE2 response signature in datasets from other enteric infections including rotavirus (Figure 6—figure supplement 1). (F) Ileal sections were removed from C. parvum-infected Ifng-/- mice and uninfected controls (each n = 3), and expression levels for the four differentially upregulated genes in the MEDLE2 response set (NUPR1, CHAC1, DDIT3, and TRIB3) were measured by qPCR. (G) HCT-8 cultures were pretreated for 2 hr with inhibitors (GSK2606414 and KIRA6) of ER stress signaling pathways prior to infection with 10,000 MEDLE2-HA parasites. After 24 hr, cells were lysed and nanoluciferase assay was performed as a measure of parasite growth. Inhibition of the IRE1 signaling pathway with KIRA6 significantly reduced parasite growth (one-way ANOVA, Dunnett’s multiple comparisons test p=0.0303; a representative experiment is shown [n = 6]). This experiment was repeated three times. (H) Ddit3-/- and C57BL/6J mice were treated with anti-mouse-IFN gamma antibody 1 day prior to infection with 10,000 MEDLE2-HA-tdNeon oocysts, and again at day 2 of infection. Fecal luminescence was determined by nanoluciferase activity to calculate the area under the curve for the duration of the infection. Ddit3-/- mice exhibited a 56% reduction in infection (1,416,227 ± 44,850; total peak area ± standard error) compared to control mice (3,189,123 ± 69,887; unpaired t test, p<0.001; n = 4 mice per group). One representative experiment is shown, which was repeated two more times, with a 54% reduction and no change in infection being observed.


