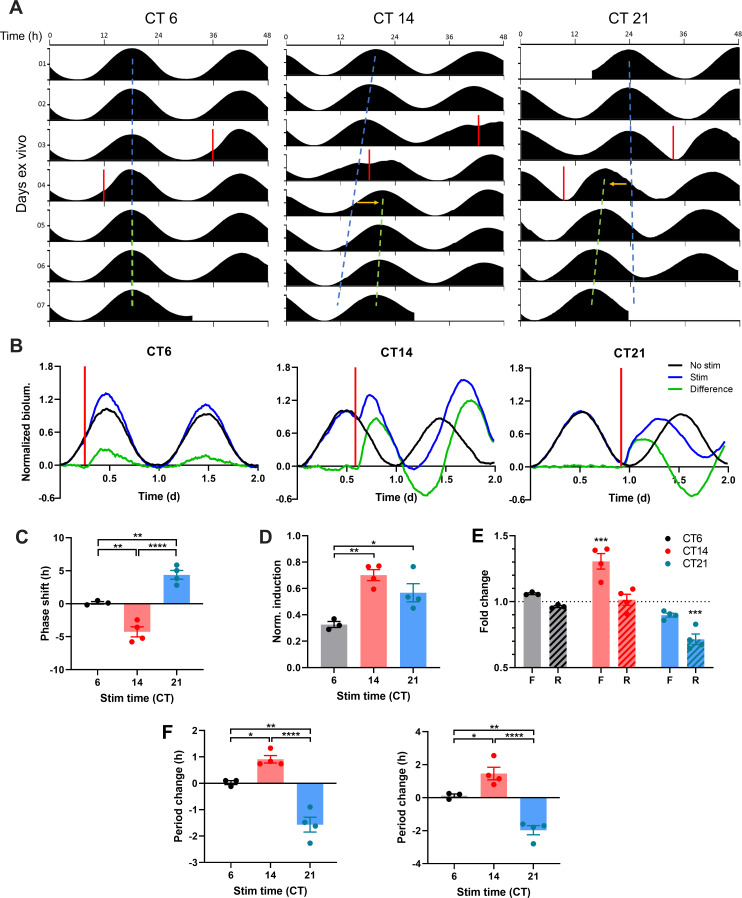
Figure 2. ChrimsonR-driven Optogenetic Stimulation Alters the Waveform of SCN PER2 Rhythms to Reset the SCN Clock.
(A) Representative double-plotted PER2::LUC bioluminescence actograms of SCN slices stimulated with single 15 min 10 Hz optogenetic pulses (red bar) at CT6 (left), 14 (middle), and 21 (right). Linear regressions of the pre-stimulation and post-stimulation cycle peaks are indicated as the blue and green dashed lines, respectively. Phase shifts are depicted by yellow arrows. (B) Representative PER2::LUC rhythms of SCN slices before and after stimulation (red bar). Green traces depict differences in normalized bioluminescence between the pre-stim and post-stim rhythms (black and blue traces, respectively). (C) Quantification of phase shifts following stimulation. Positive and negative phase shifts indicate phase advance and delay, respectively. (One-way ANOVA with Tukey’s multiple comparisons test, mean ± SEM, n = 3–4, **p < 0.01, ****p < 0.0001). (D) Normalized PER2::LUC induction following stimulation. (One-way ANOVA with Tukey’s multiple comparisons test, mean ± SEM, n = 3–4, *p < 0.05, **p < 0.01). (E) Fold change in duration of the rising (R; dashed boxes) and falling (F; open boxes) phases of PER2::LUC rhythms following stimulation. (RM two-way ANOVA with Sidak’s multiple comparisons tests, mean ± SEM, n = 3–4, ***p < 0.001). (F) Quantification of period changes following stimulation using linear regression of peaks (left) and Lomb-Scargle periodogram (right). Positive and negative period changes indicate period lengthening and shortening, respectively. (One-way ANOVA with Tukey’s multiple comparisons test, mean ± SEM, n = 3–4, *p < 0.05, **p < 0.01, ****p < 0.0001).

