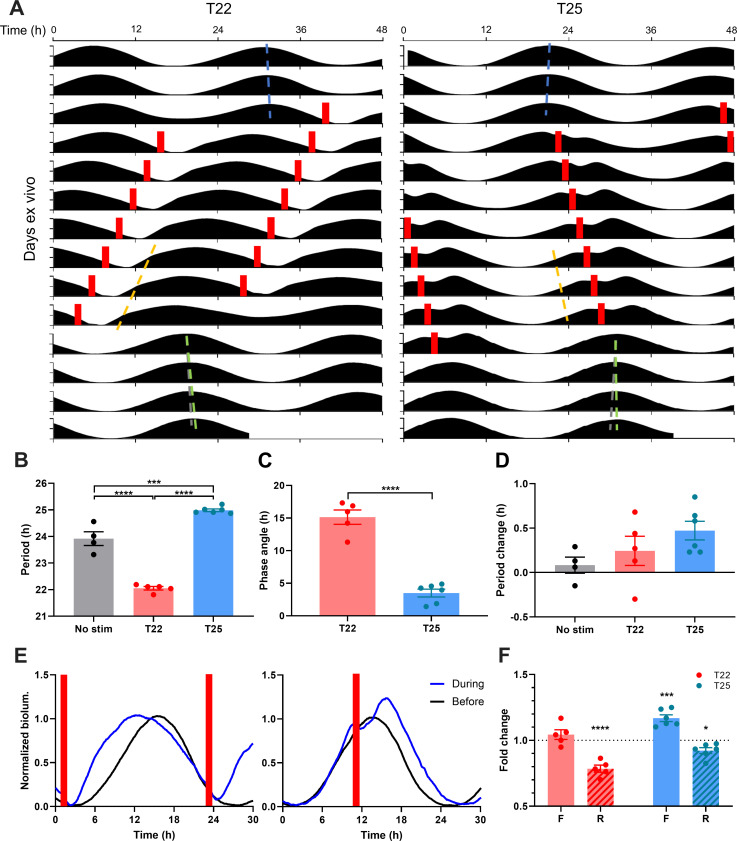
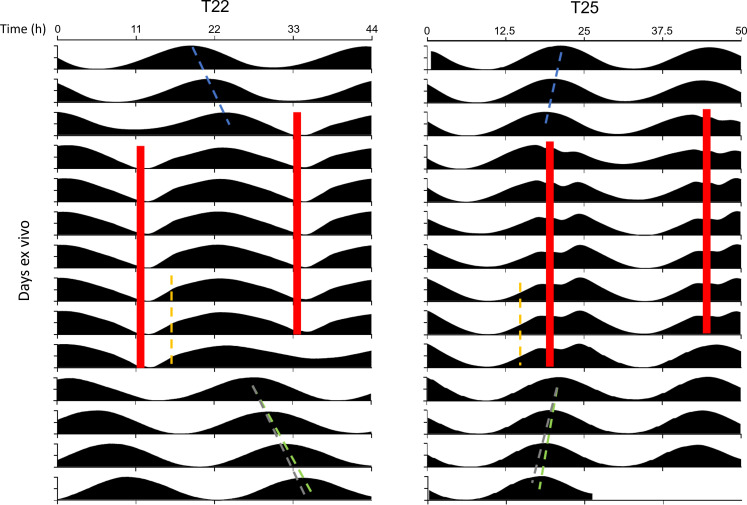
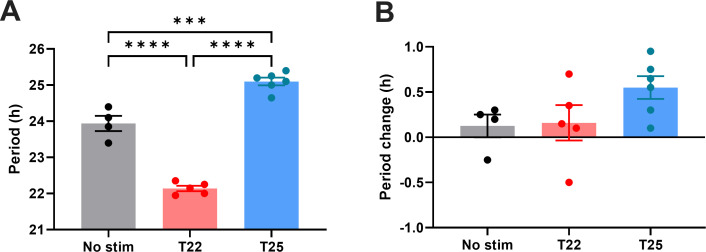
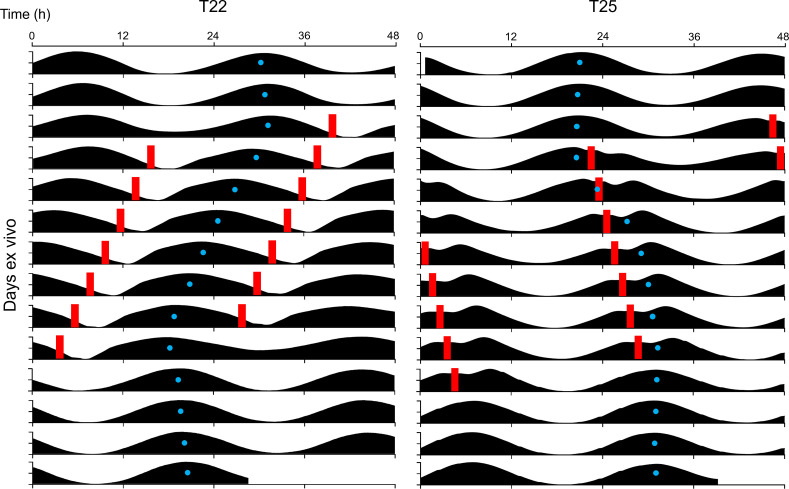
Figure 3. Optogenetic Cycles Entrain PER2::LUC Rhythms in the SCN by Triggering Daily Waveform Changes that Match the SCN Clock to the Cycle Period.
(A) Representative double-plotted PER2::LUC bioluminescence actograms of SCN slices entrained with 1–1.5 hr 10 Hz optogenetic pulse (red bars) every 22 hr (left) or 25 hr (right). Linear regressions of the pre- and post-entrainment cycle peaks are indicated as the blue and green dashed lines, respectively. Yellow dashed lines indicate half-maxes on the rising phase during entrainment. Grey dashed lines indicate the pre-entrainment cycle period as a reference. (B–D) Quantification of period during entrainment (B), phase angle of entrainment (C), period change by entrainment (D). (B and D) were analyzed using one-way ANOVA with Tukey’s multiple comparisons tests (mean ± SEM, n = 4–6, ****p < 0.0001, ***p < 0.001), (C) was analyzed using Student’s t-test (mean ± SEM, n = 5–6, ****p < 0.0001). (E) Representative waveforms of PER2::LUC bioluminescence rhythms before (black trace) and during (blue trace) entrainment to T22 (left) and T25 cycles (right). Red bars depict optogenetic stimulation during entrainment. (F) Fold change in duration of the rising (R; dashed boxes) and falling (F; open boxes) phases of PER2::LUC rhythms during entrainment compared with before entrainment. (RM two-way ANOVA with Sidak’s multiple comparisons tests, mean ± SEM, n = 5–6, ***p < 0.001, ****p < 0.0001).


