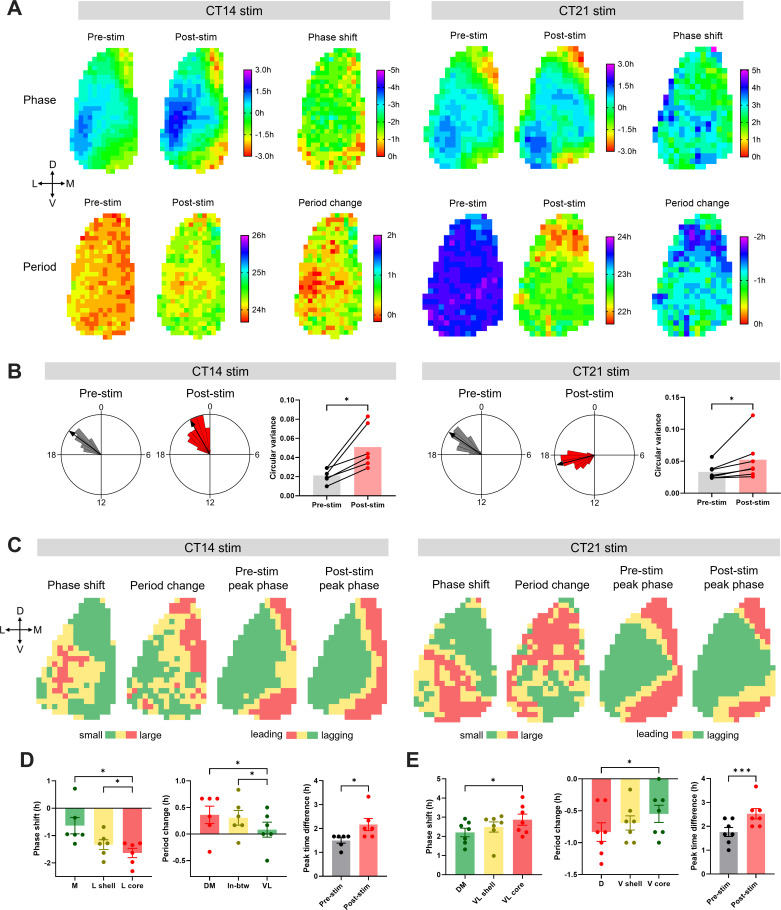
Figure 6. Regional distribution of circadian phase and period in the SCN, and heterogeneity of the phase and the period responses in the SCN to optogenetic light pulses.
(A) The upper row shows phase maps of PER2::LUC bioluminescence rhythms in the unilateral SCN before and after optogenetic stimulation at CT14 (left) or CT21 (right), and regional distribution of the phase shifts in response to corresponding stimulation. The lower row displays the period maps before and after the stimulation, and the period change maps. The crossed arrows denote the SCN orientation. D = dorsal, V = ventral, M = medial, L = lateral. The phase maps depict peak times in hours relative to the mean in each condition. Pre-stim and post-stim phases indicate the last peak before stimulation and the first peak after stimulation, respectively. Positive and negative phase shifts indicate phase advances and delays, respectively. Positive and negative period changes indicate period lengthening and shortening, respectively. (B) Representative Rayleigh plots (24 hr circular plots) for regional peak PER2::LUC phases in the SCN, and bar graphs of the circular variance before and after optogenetic stimulation at CT14 (left) or CT21 (right). (Wilcoxon matched-pairs test, n = 6–7, *p < 0.05). The arrows in the Rayleigh plots indicate mean Rayleigh vectors. (C) Group-averaged clusters of the phase shift, period change, pre-stimulation peak phase, and post-stimulation peak phase for CT14 (left) or CT21 (right) stimulation (n = 6–7). Clusters were hierarchically formed using Ward’s minimum variance method. Different colors indicate different clusters. The crossed arrows denote the SCN orientation. D = dorsal, V = ventral, M = medial, L = lateral. (D–E) Phase shifts (left) and period changes (middle) in corresponding clusters in (C), and peak time differences between the phase-leading and the phase-lagging clusters (right) for CT14 (D) or CT21 stimulation (E). Phase shifts and period changes were analyzed using RM One-way ANOVA with Tukey’s multiple comparisons test, mean ± SEM, n = 6–7, *p < 0.05. Peak time differences were analyzed using paired t-test, mean ± SEM, n = 6–7, *p < 0.05, ***p < 0.001.


