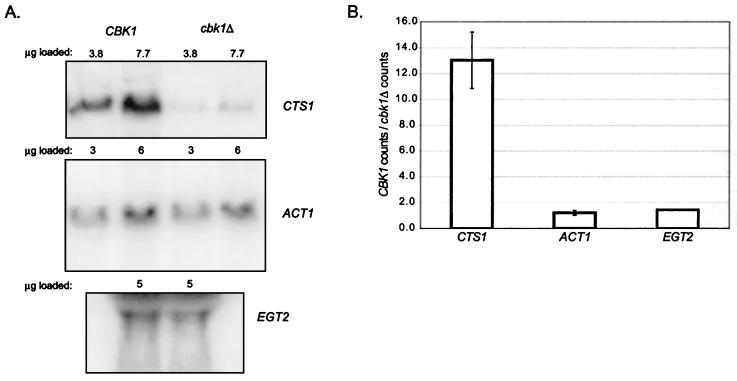
FIG. 9.
Northern analysis of CTS1 mRNA levels in wild-type and cbk1Δ mutant cells. (A) Northern blots showing CTS1 (top), ACT1 (middle), and EGT2 (bottom) message levels in wild-type and cbk1Δ mutant cells. The amount of total RNA loaded in each lane is indicated above the corresponding lane. (B) Relative expression of CTS1, ACT1, and EGT2 mRNAs in wild-type and cbk1Δ cells, expressed as the ratio of PhosphorImager counts (arbitrary units) of mRNA from wild-type cells over mRNA from cbk1Δ mutant cells.

