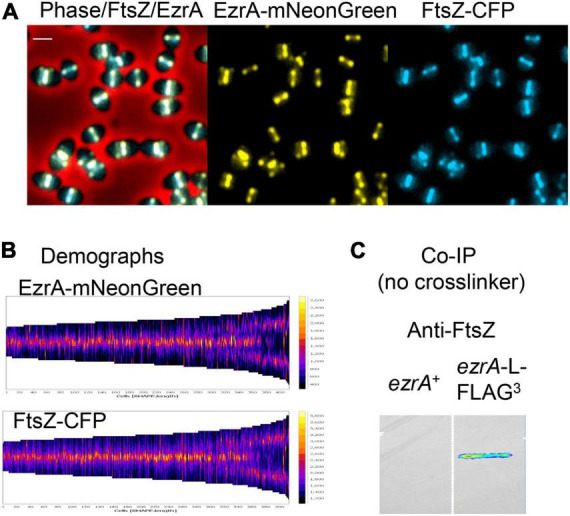
FIGURE 1.

Highly correlated localization patterns of FtsZ and EzrA during the Spn cell cycle. Cells from at least two independent biological replicates were collected at OD620 ≈ 0.1–0.2 and prepared for microscopy or co-IP as described in section “Materials and Methods.” (A) Representative field of live cells expressing EzrA-mNeonGreen and FtsZ-CFP (IU14153). Scale bar is 1.0 μm. (B) Demographs showing FtsZ and EzrA localization from shorter pre-divisional cells (left side) to longer post-divisional cells (right side). (C) Membrane probed with anti-FtsZ showing EzrA-FLAG3 (IU5456) can co-IP FtsZ from non-crosslinked Spn cells relative to untagged EzrA+ (IU10447).
