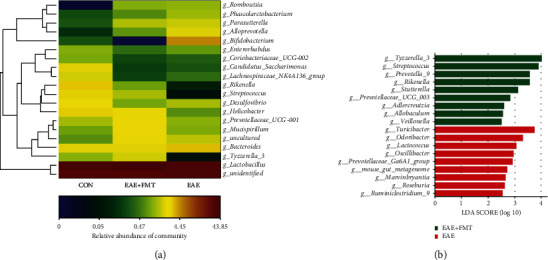
Figure 3.

Differences in dominant microorganisms among groups based on genus abundance. (a) Heat map of the most differentially abundant features at the genus level. Relative abundance is indicated by a color gradient from blue to red, with blue representing low abundance and red representing high abundance. (b) LEfSe analysis of the groups (n = 6 each). CON: control; EAE: experimental autoimmune encephalomyelitis; EAE+FMT: fecal microbiota transplantation.
