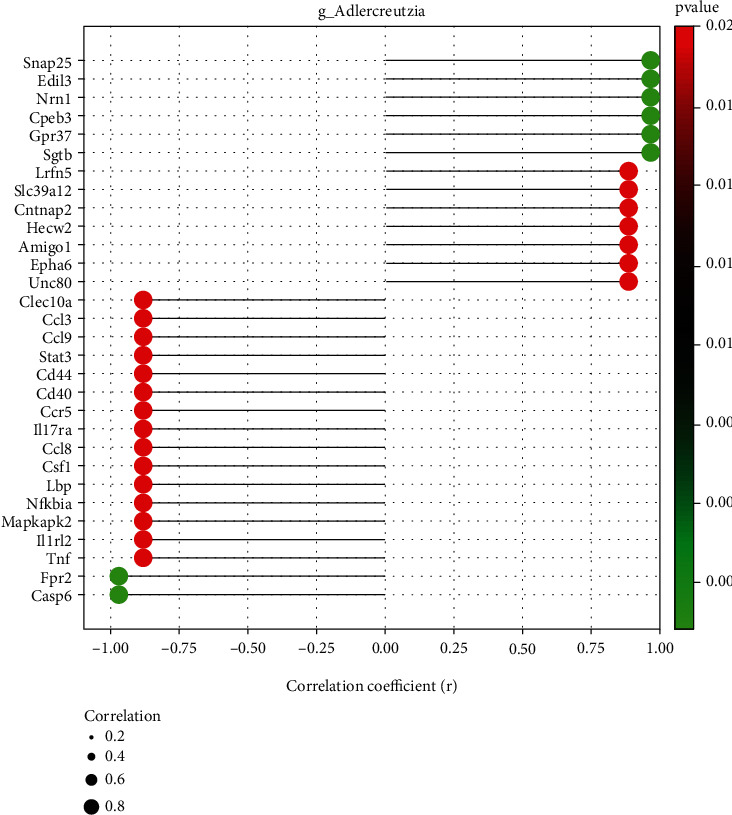
Figure 5.

Correlations between relative genus abundance and the transcriptome. (a) A lollipop shape displayed microbe-gene correlations (∣R | >0.8, P < 0.05). Positive values indicate positive correlations, and negative values indicate negative correlations.
