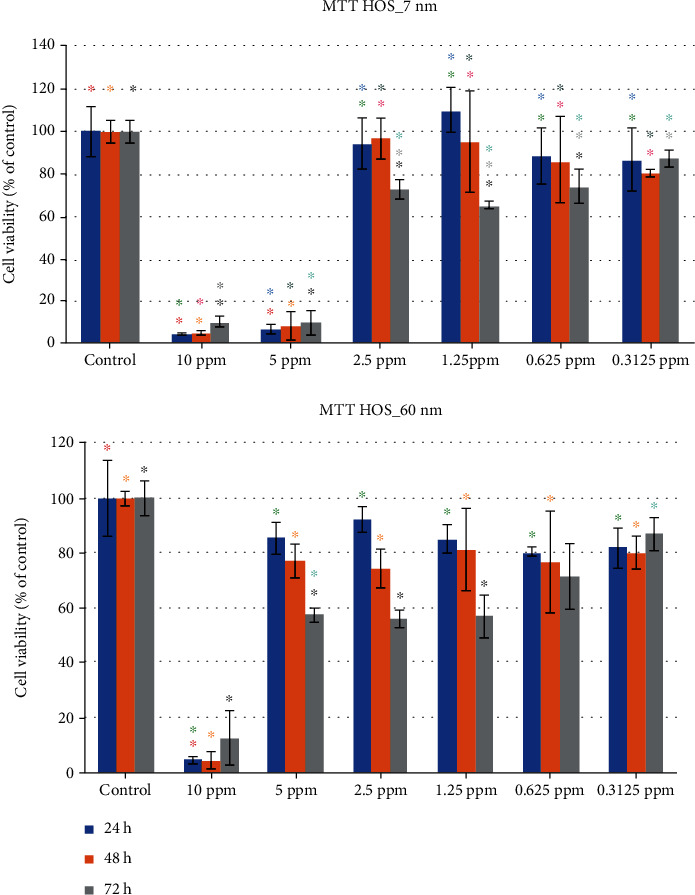
Figure 8.

HOS cell viability (percentage values), when subjected to exposure of different concentrations of 7 nm and 60 nm AgNPs (same color asterisks indicate statistically significant differences between the control and suspensions of different AgNP concentrations. Absence of asterisks or absence of same color asterisks indicates no statistically significant differences, according to Tukey's HSD test for α = 0.05).
