
Figure 1.
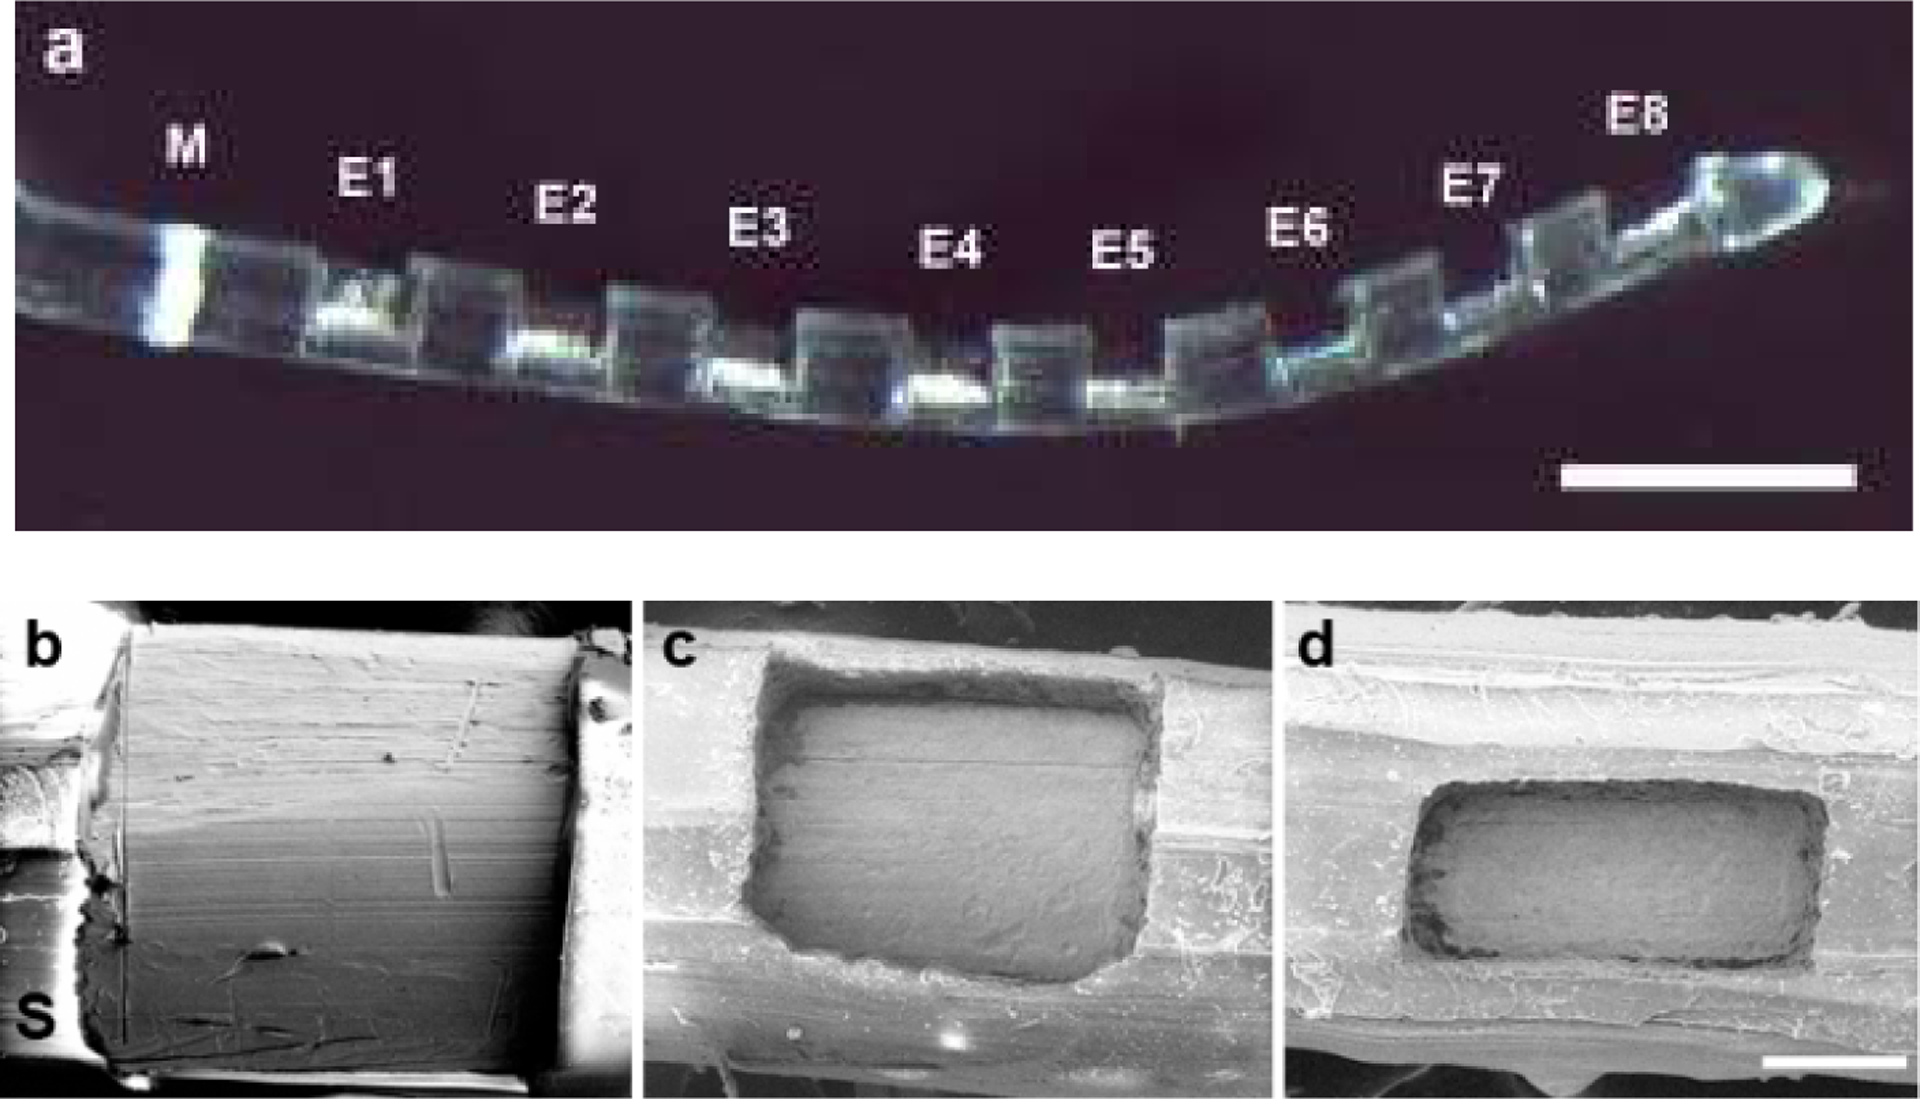
(a) Low power micrograph of a HL8 research electrode array illustrating the 8 Pt electrodes (E1-E8) on the array. All Pt contact areas on each array were identical. The white band (M) is used as a surgical guide to ensure a uniform insertion depth for each electrode array. Scale bar = 1 mm. (b) – (d) Scanning electron micrographs illustrating the three Pt contact areas used in this study. (b) 0.2 mm2; (c) 0.075 mm2; (d) 0.05 mm2. S = PDMS silicone. Scale bar = 100 μm.