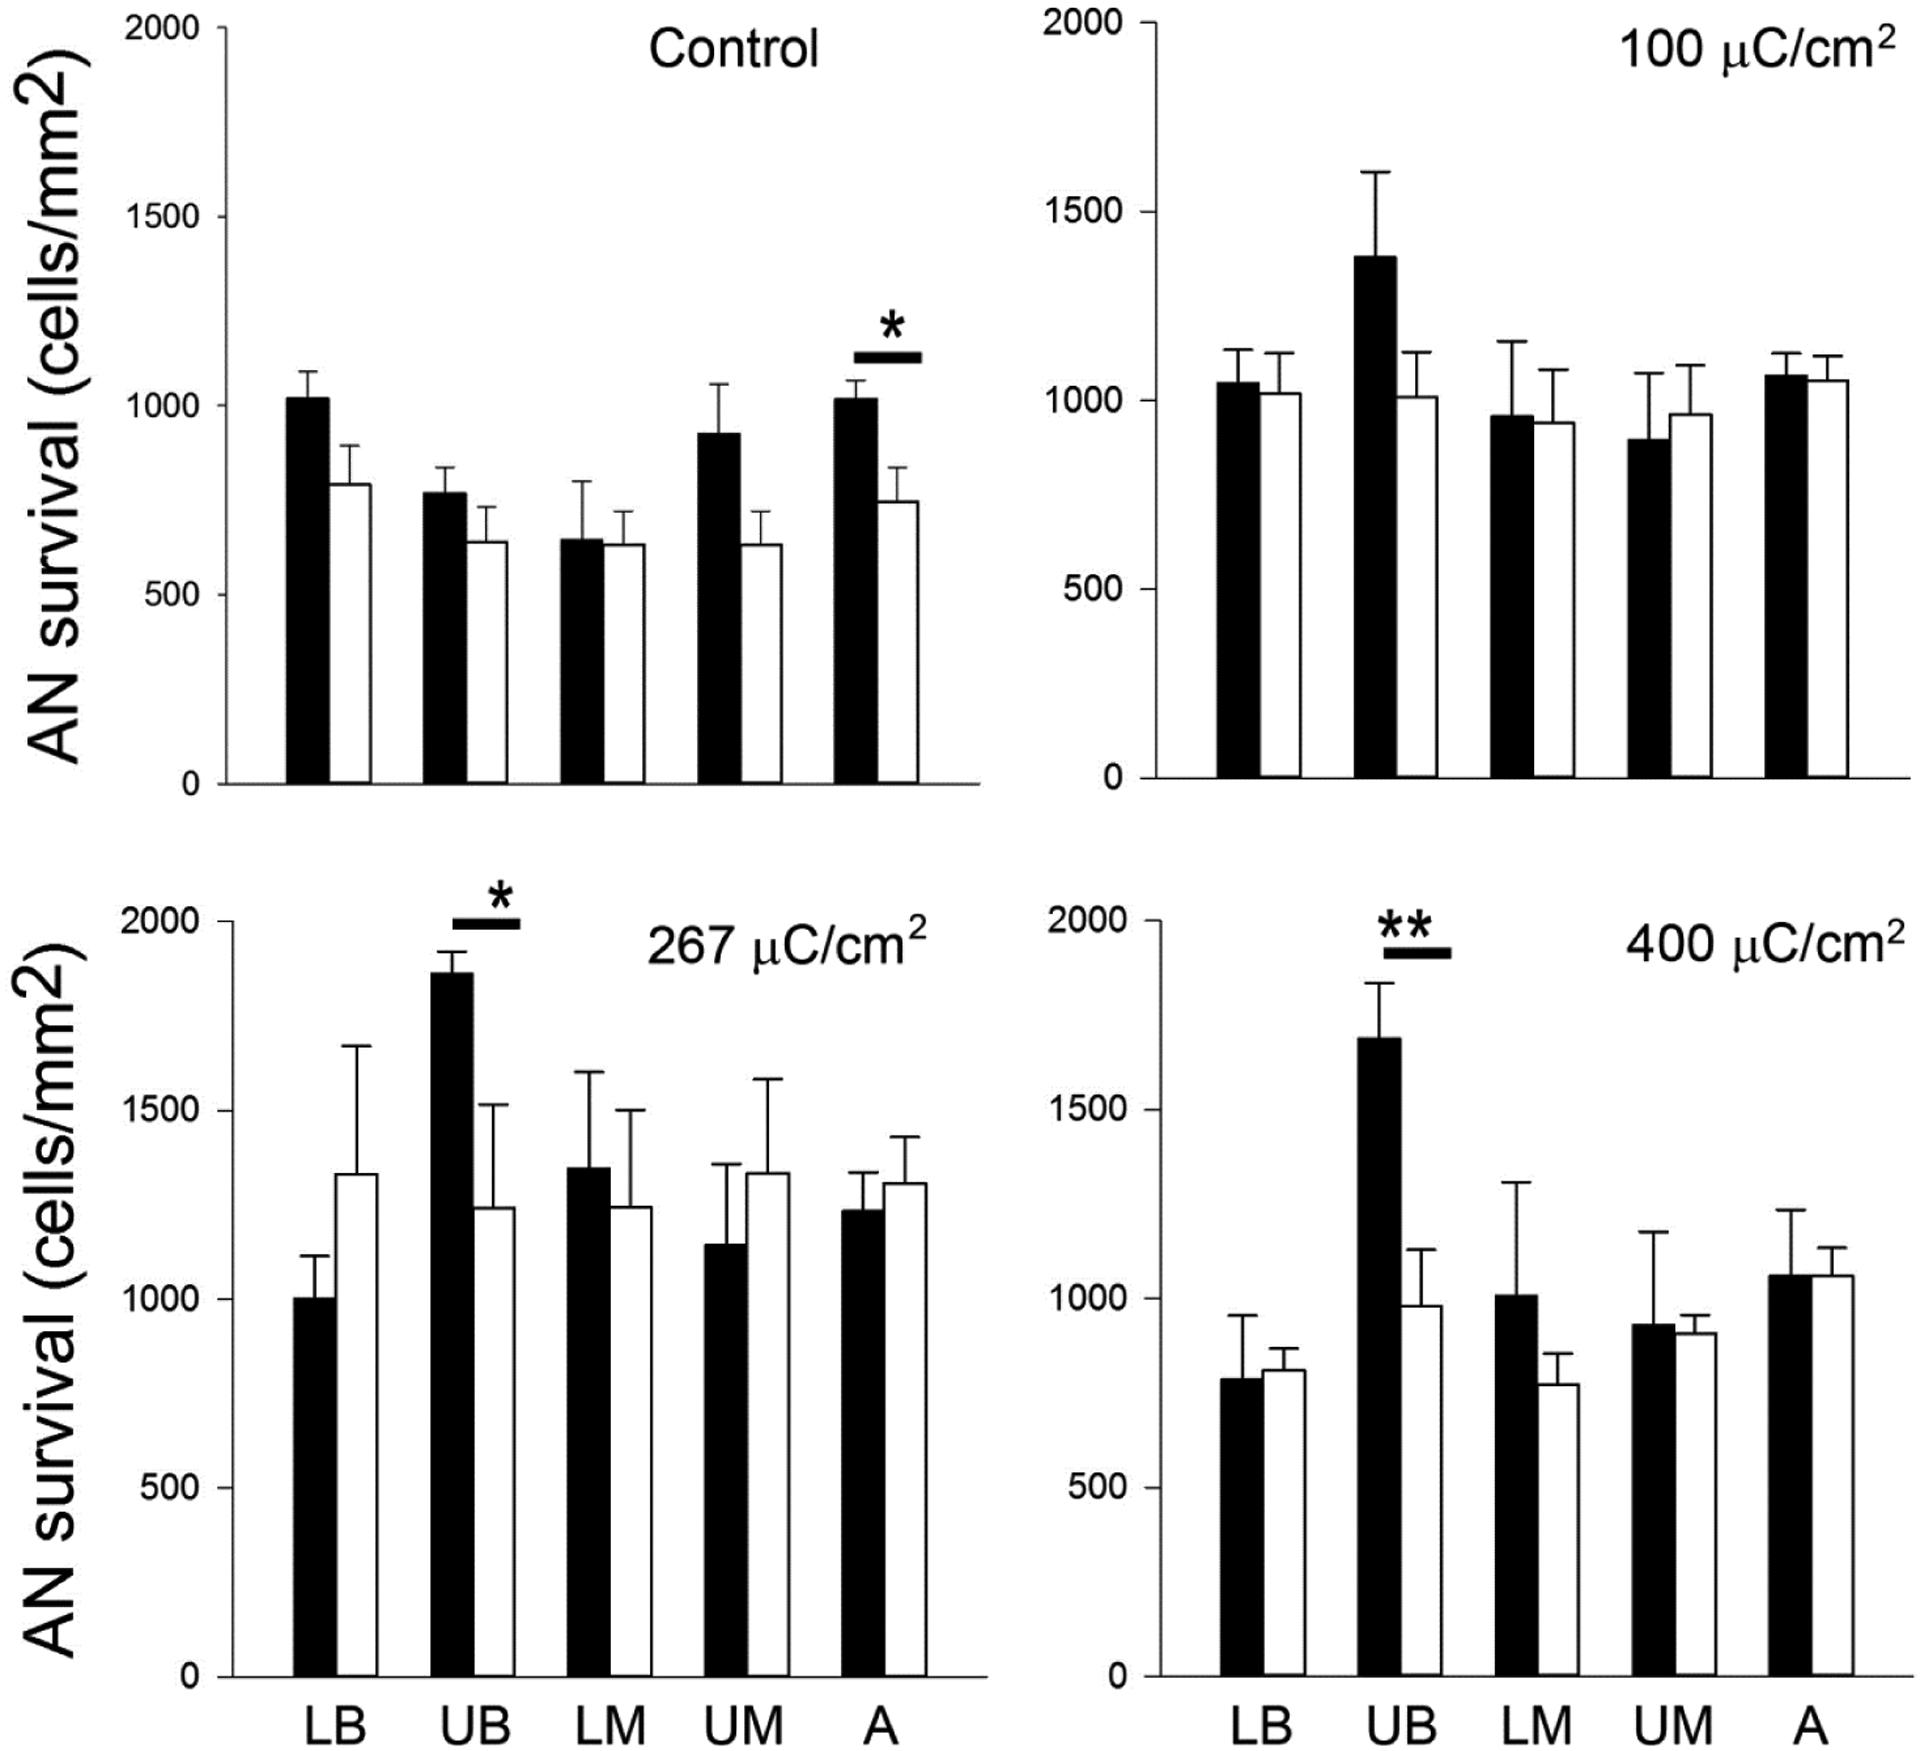
Figure 9.

Mean AN density for both the implanted and contralateral control cochleae for each cohort in this study (black bars = implanted; open bars = contralateral controls). AN density was greater in the UB turn (i.e. the site of stimulation) of the three stimulated cohorts compared with their paired control. This difference was statistically significant at 267 and 400 μC/cm2/phase. There was also a statistically significant difference in the apical region of the unstimulated control cochleae, however there was no statistically significant difference in any other region of control or stimulated cochleae (i.e. LB, LM, UM and A turns). * p < 0.05; ** p < 0.01 (Paired t-test; Error bar = sem).
