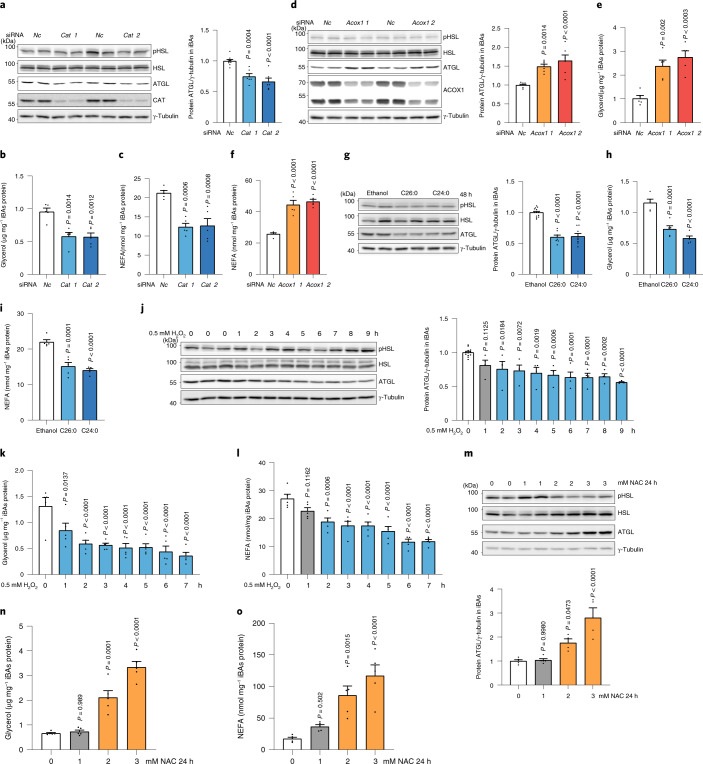
Fig. 5. Peroxisomal β-oxidation-derived ROS regulate ATGL protein and lipolysis in iBAs.
a–c, iBAs were transfected with Cat siRNA. After 72 h, IB, glycerol and NEFA measurement were conducted to check lipolytic proteins or lipolysis levels (n = 6 in Cat and 10 in Nc siRNA, F = 22 (a); n = 5, F = 13.74 (b) and 16.12 (c)). d–f, iBAs were transfected with Acox1 siRNA. After 72 h, IB, glycerol and NEFA measurements were conducted to check lipolytic proteins or lipolysis levels (n = 6 in Acox1 and 8 in Nc siRNA, F = 16.74 (d); n = 5, F = 16.6 (e) and 35.79 (f)). g–i, iBAs were treated with 100 μM C26:0 and C24:0 for 48 h. IB, glycerol and NEFA measurements were conducted to check lipolytic proteins or lipolysis levels (n = 8 in VLCFAs treatment and 13 in control, F = 60.22 (g); n = 5, F = 34.4 (h) and 29.5 (i)). j–l, iBAs were treated with 500 μM H2O2 at the indicated time points. IB, glycerol and NEFA measurements were conducted to check lipolytic proteins or lipolysis levels (n = 4 in H2O2 treatment and 12 in control, F = 7.451 (j); n = 5, F = 9.331 (k) and 15.92 (l)). m–o, iBAs were treated with 1 mM, 2 mM and 3 mM NAC for 24 h. IB, glycerol and NEFA measurements were conducted to check lipolytic proteins or lipolysis levels (n = 4 in 2 mM and 3 mM NAC treatment and 5 in 0 mM and 1 mM NAC treatment, F = 17.13 (m); n = 5, F = 48.29 (n) and 16.28 (o)). Results are shown as the mean ± s.e.m. and analysed using ANOVA with Dunnett correction for multiple comparisons between control and other groups.

