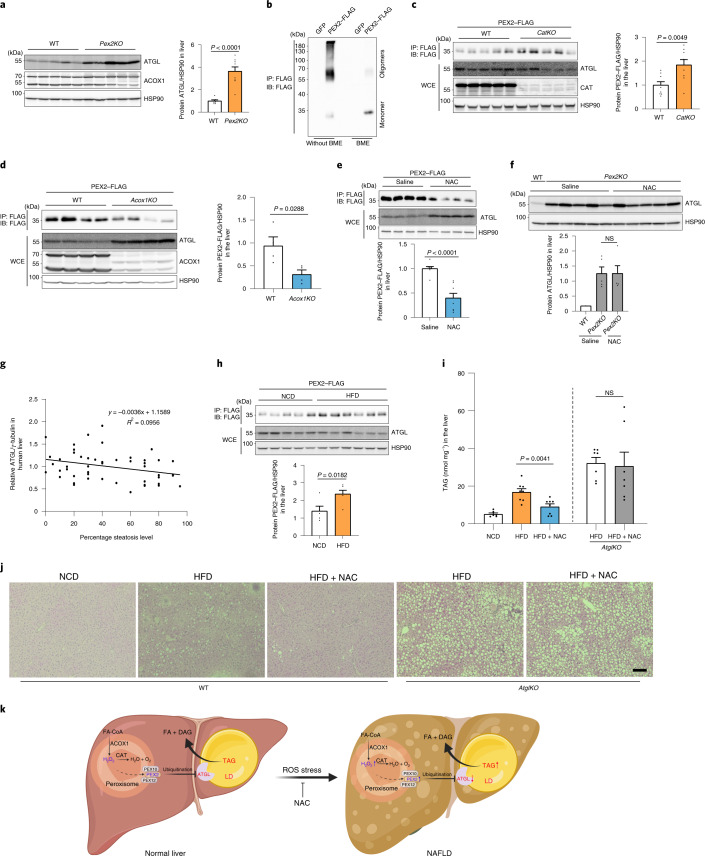
Fig. 7. Functions of peroxisomal β-oxidation and ROS in regulating ATGL levels and TAG mobilization in the liver.
a, Two weeks after Pex2 knockout induction, livers were collected and hepatic proteins were analyzed by IB, as indicated (wild-type n = 7; Pex2KO n = 9). b, PEX2–FLAG was expressed for 2 weeks before liver collection and homogenization. IP and IB were conducted using the indicated antibodies. Experiments were repeated four times. c,d, PEX2–FLAG was expressed in the liver of CatKO or Acox1KO mice. IP and IB were conducted using the indicated antibodies (n = 9 (c); n = 4 (d)). e, PEX2–FLAG was expressed in the liver of wild-type mice. After 2 weeks, NAC was administered to the mice via intraperitoneal injection at a dose of 500 mg kg−1 body weight for 24 h. IP and IB were conducted using the indicated antibodies (n = 8). f, NAC was administered to the Pex2KO KO mice for 24 h. Livers were collected and hepatic proteins were analysed by IB (n = 5 for Pex2KO for both conditions). g, ATGL levels in human liver biopsies were analysed by IB and the relative ATGL levels are presented (50 human samples). P = 0.0372 using a Spearman test. h, Wild-type mice with PEX2–FLAG expression in the liver were challenged with HFD for 16 weeks. IP and IB were conducted using the indicated antibodies (n = 5). i, Wild-type and AtglKO mice were fed with NCD, HFD and HFD plus NAC (40 mM) in drinking water for 8 weeks. Liver lipids were extracted for TAG level determination (for wild-type mice, NCD n = 6, HFD n = 7, HFD + NAC n = 7; for AtglKO mice, n = 7). NCD, normal chow diet. j, Representative hematoxylin and eosin staining images of livers from wild-type or AtglKO mice fed on HFD and NAC-containing water for 8 weeks. Scale bar, 100 μm. Experiments were repeated three times. k, Working model illustrating the whole pathway in which peroxisomal β-oxidation generates H2O2 to stabilize PEX2 protein, resulting in increased ATGL degradation and decreased lipolysis in turn. Results are shown as the mean ± s.e.m. analysed using a two-sided Student’s t-test.

