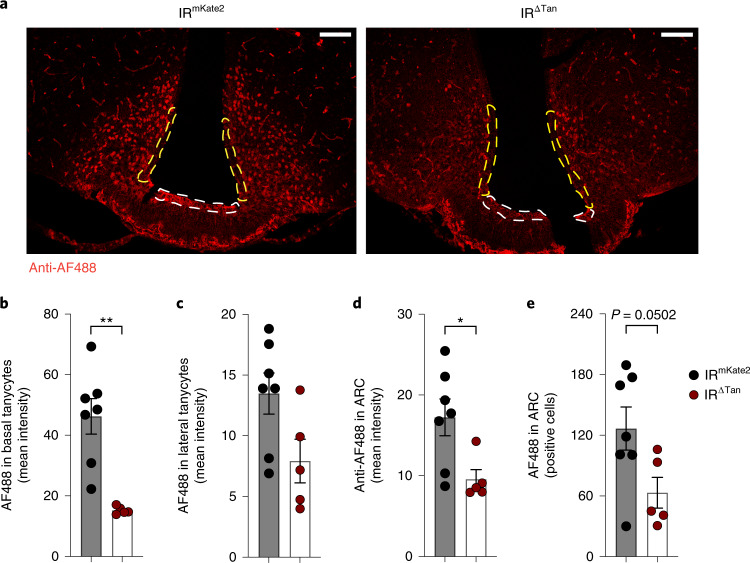
Fig. 2. Insulin uptake in tanycytes and MBH is distorted in IR∆Tan mice.
a, Representative images of immunostaining for fluorescently labelled insulin (anti-Alexa-Fluor-488) 15 min post i.v. injection of 488-insulin (250 nmol kg−1) in IRfl/fl mice, which received either AAV-Dio2-mKate2 (IRmKate2) control or Cre-recombinase-expressing AAV-Dio2-Cre virus (IRΔTan). 488-insulin was quantified in DAPI-positive tanycyte layer. White and yellow dashed lines indicate quantified ROI in basal and lateral tanycytes, respectively. b–d, Mean intensity signal of Alexa-Fluor-488 fluorescent insulin in basal, P = 0.013, (b) and lateral (c) tanycytes and ARC, P = 0.0251, (d) of IRmKate2 and IRΔTan mice. e, Quantification of Alexa-Fluor-488-positive cells per hemisphere of ARC of IRmKate2 and IRΔTan mice, P = 0.0502. b,d,e, Unpaired, two-sided Student’s t-test. a–e, n = 7/IRmKate2, 5/IRΔTan. Data are represented as the mean ± s.e.m. Scale bar, 100 µm.

