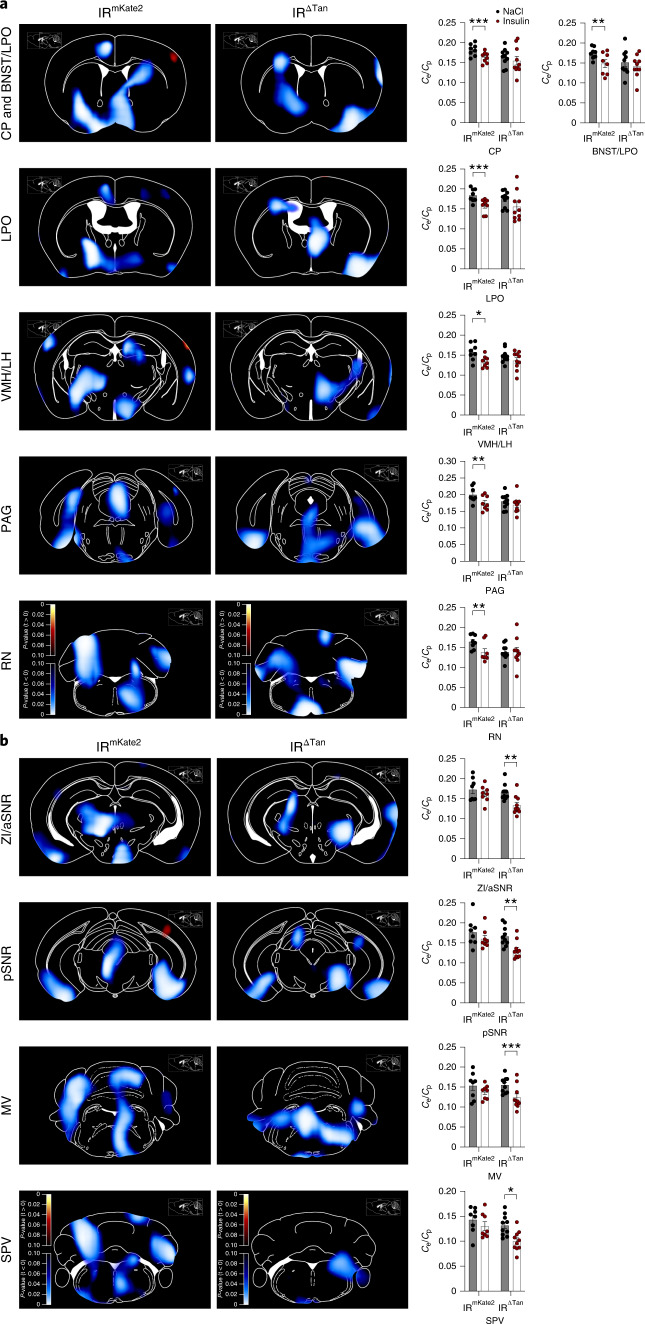
Fig. 5. Altered insulin-evoked signalling in IRΔTan mice.
a,b, Parametric maps of P values from paired t-test of differences in cumulative glucose metabolism over the recorded time determined by [18 F]FDG PET between insulin-stimulated (16-h fasted, i.p. 0.325 IU kg−1 insulin) and NaCl (0.9%)-injected, anaesthetized IRmKate2 and IRΔTan mice (n = 8/IRmKate2; n = 10/IRΔTan). Brain regions that had significantly reduced cumulative glucose metabolism in IRmKate2 were not altered in IRΔTan mice (a), and brain regions that had significantly reduced signal in IRΔtan remained unaltered in IRmKate2 (b). Blue colour scale indicates regions where metabolism at NaCl > insulin (inhibition on insulin injection). Sagittal reference image inserts show location of corresponding coronal plates86. Ce/Cp is the ratio of tissue and blood glucose concentrations, a blood glucose level-insensitive measure for glucose metabolism. CP, caudate putamen; BNST/LPO, bed nucleus of stria terminalis/lateral preoptic area; PAG, periaqueductal grey; RN, reticular nucleus; ZI/aSNR, zona incerta/anterior substantia nigra; pSNR, posterior substantia nigra; MV, medial vestibular nucleus; SPV, spinal vestibular nucleus. Paired, two-sided Student’s t-test. a, For IRmKate2 P(CP) = 0.0007, P(BNST/LPO) = 0.0056, P(LPO) = 0.0003, P(VMH/LH) = 0.0109, P(PAG) = 0.0015, P(RN) = 0.0097, b, For IRΔTan P(ZI/aSNR) = 0.003, P(pSNR) = 0.0023, P(MV) = 0.0006, P(SPV) = 0.0105. Data are represented as the mean ± s.e.m. * - P <0.05, ** - P <0.01, *** - P <0.001.

