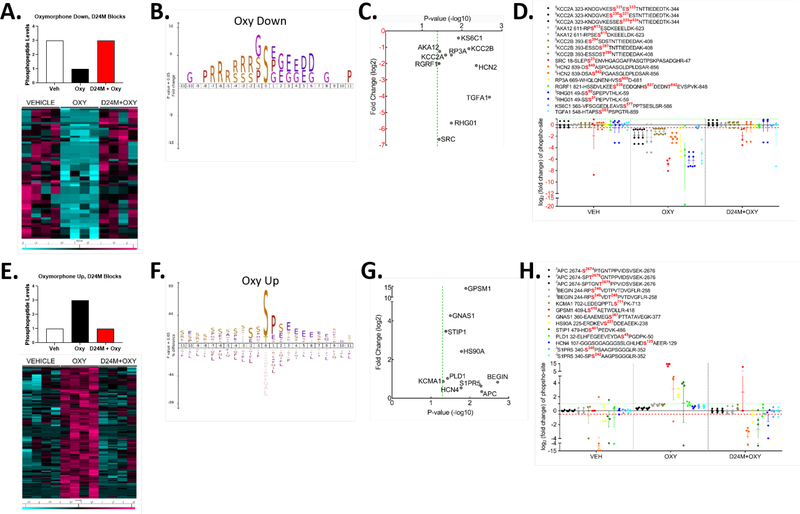
Figure 6: Phosphoproteomic analysis of the MDOR-modulated signaling network.
The data extracted from Figure 5D was subjected to further analysis. A) The “Oxymorphone Down” group is highlighted, with an idealized graphical scheme of phosphopeptides repressed by oxymorphone and then restored by D24M treatment. A heat map is shown of the resulting 45 unique phosphopeptides from 42 unique proteins (teal = reduced, fuchsia = increased, columns = individual mice, rows = individual proteins). B) iceLogo analysis of the phosphopeptides in the “Oxymorphone Down” group. 0 = the phosphosite, with + residue positions downstream and – residue positions upstream. Standard amino acid codes are used, and the size of the letter represents the relative prevalence of that residue at that position. C) Selected proteins from the “Oxymorphone Down” group are graphed, showing significance vs. fold change. Standard gene names are used for each. D) The individual fold change values for each phosphopeptide from C are graphed. The key above shows the sequence and phosphosite for each detected peptide of the protein. E) The “Oxymorphone Up” group is highlighted, with an idealized graphical scheme of peptides induced by oxymorphone and blocked by D24M treatment. A heat map is shown of the resulting 239 unique phosphopeptides from 170 unique proteins (teal = reduced, fuchsia = increased, columns = individual mice, rows = individual proteins). F) iceLogo analysis for the “Oxymorphone Up” group performed as in B. G) Selected signaling proteins from the “Oxymorphone Up” group displayed as in C. H) Individual phosphopeptides quantities for the set in G displayed as in D.

