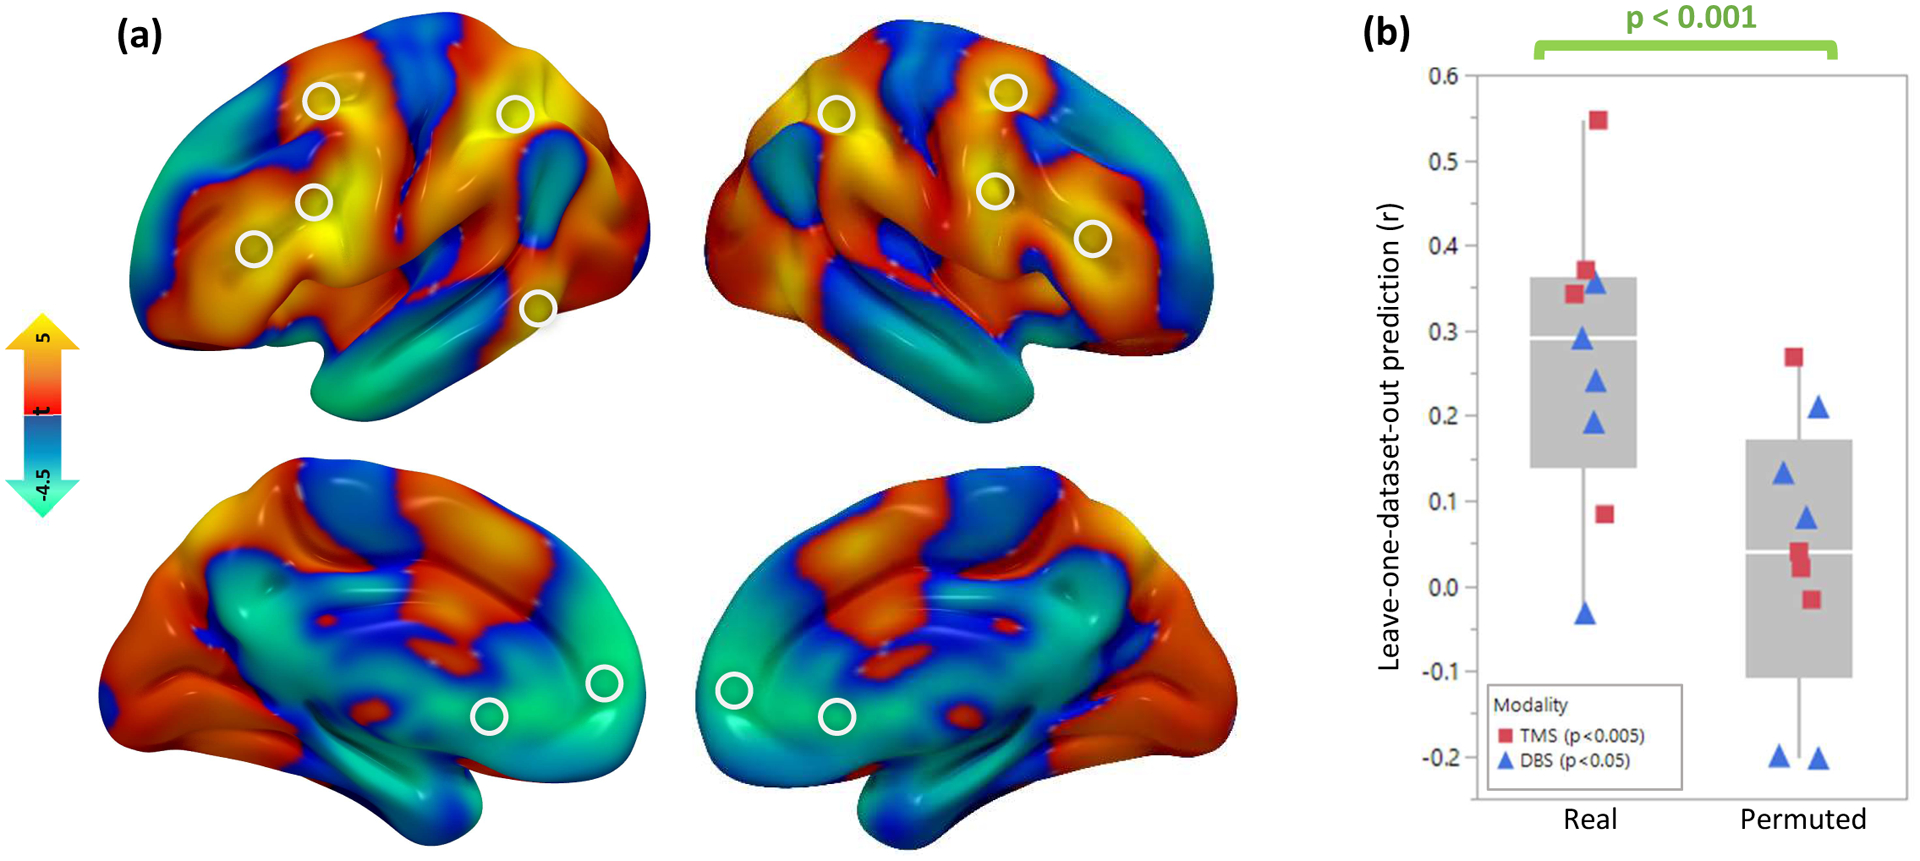
Figure 5: Combining all circuit maps and predicting clinical variance.

(a) A combined “depression circuit” was generated from all 14 datasets. Peaks in this circuit are depicted with white circles. Positive peaks included the dorsolateral prefrontal cortex, frontal eye fields, inferior frontal gyrus, intraparietal sulcus, and extrastriate visual cortex. Negative peaks included the subgenual cingulate cortex and ventromedial prefrontal cortex. Peaks are listed in Supplementary Table 2. (b) Across the 9 neuromodulation cohorts (n=252), antidepressant efficacy was predicted by stimulation site connectivity to a circuit generated from the remaining 13 cohorts (mean r=0.22). Permutation testing confirmed that this similarity was stronger than expected by chance (p<0.001, 10,000 permutations). This was true for both TMS (n=151, r=0.24, p=0.0034 with 10,000 permutations) and DBS (n=101, r=0.21, p=0.033 with 10,000 permutations). Line = median, box limits = interquartile range, whiskers = outliers, points = individual correlation value for each neuromodulation dataset.
