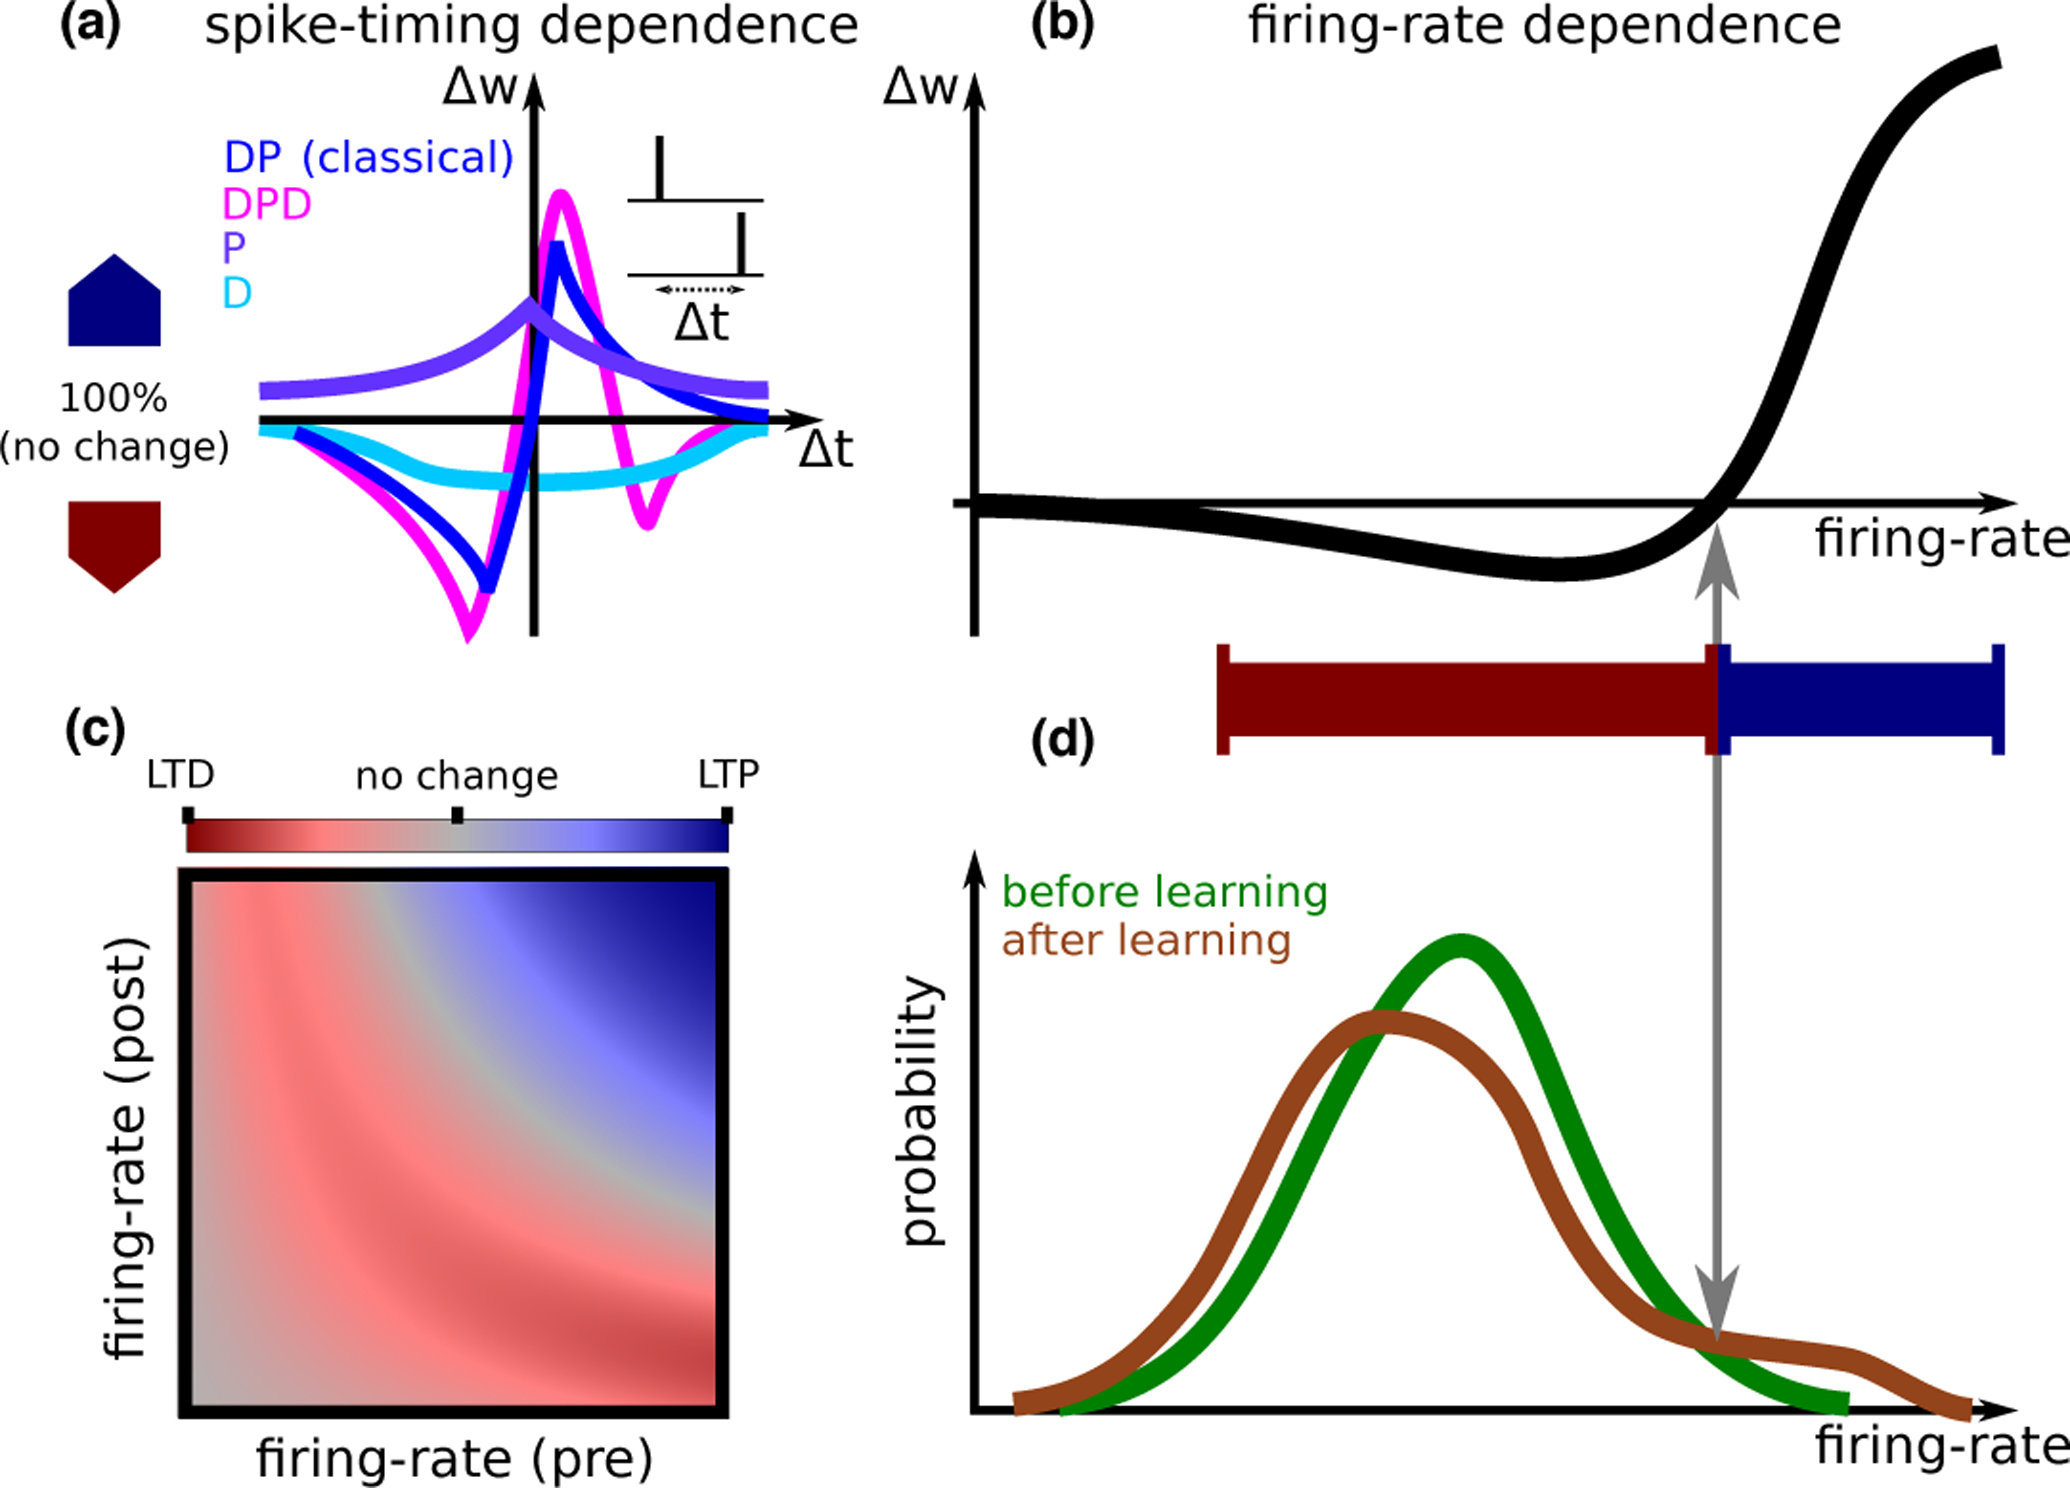
Figure 1: Synaptic plasticity.

A. STDP (spike timing dependent plasticity) curves (i.e., dependence of synaptic plasticity on the timing difference between pre- and postsynaptic spikes Δt) observed experimentally. A number of qualitatively distinct STDP curve shapes have been reported experimentally: The classical curve (dark blue, seen e.g., in hippocampal cultures [2] and cortical slices [3]) exhibits a depression window followed by a potentiation window ; A curve with a second depression window (, magenta, seen in CA3 to CA1 connections at high calcium concentration[4•]); A curve with only potentiation (, purple, seen in area CA3 [5], in hippocampal cultures in the presence of dopamine[6]); and finally a curve with only depression (, light blue, in CA3 to CA1 connections at low extra-cellular calcium concentrations[7, 4•]).A calcium based model can account for all curve shapes with different choices of parameters [8], and for the transition between different curves as a function of the extracellular calcium concentration [4•]. B. Models from each of the classes discussed in the text are typically fit to in vitro data based on plasticity protocols where the same pre-post pattern of activity is repeated. These models all give qualitatively similar firing rate dependence, which is similar to the BCM rule [9]. The specific shape of the non-linearity, and in particular the threshold separating LTD and LTP, depends on the model and its parameters, and on whether pre/postsynaptic (or both) firing-rate(s) are varied. A learning rule inferred from in vivo data [10•] gives a similar dependence on firing rate. C. Models can also be used to predict synaptic plasticity for independent pre- and postsynaptic firing-rates. Shown here qualitatively is the magnitude of LTD (red) and LTP (blue), in a scenario where synaptic modifications are well approximated by the form Δw = g(rpre)f(rpost) [10•]. The dependence of plasticity on both pre- and postsynaptic firing rate, varying as two independent variables, has not yet been characterized experimentally. D. Inferring plasticity rules from in vivo data. The firing-rate distribution of a single neuron in response to sensory stimuli exhibits significant differences between novel and familiar stimuli. These differences can be used to reverse-engineer a learning rule that causes such differences. This learning rule has a dependence on the postsynaptic firing rate that is qualitatively similar to the curve in panel B. Such a learning rule sparsens the representation of sensory stimuli, decreasing the response of most neurons (those that respond with a firing rate that is smaller than the threshold between LTD and LTP), but leading to an increased response for a small subset of neurons that have initially the strongest response [10•].
