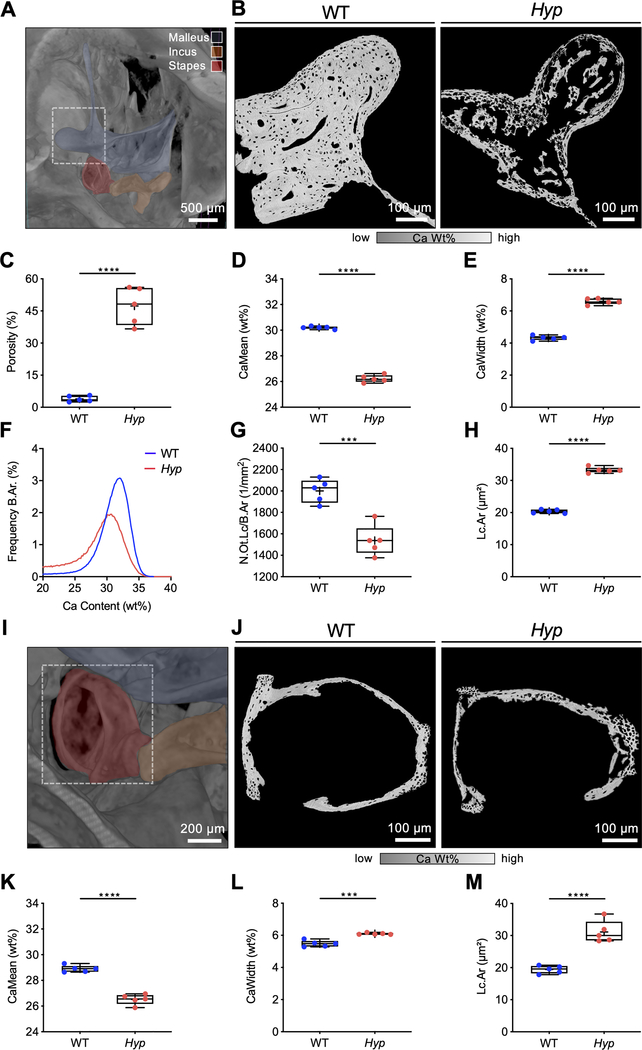
Fig. 3. Irregular and reduced mineralization of the malleus and stapes evaluated by qBEI in WT and Hyp mice.
(A) A representative three-dimensional reconstruction of μCT-imaging of a murine WT middle ear (24-week-old male mice) with virtual fenestration of the temporal bone and pseudocolors highlighting the anatomical localization of the ossicles. (B-H) qBEI analysis of the malleus. (B) Representative qBEI images of the malleus of WT (left panel) and Hyp mice (right panel). (C) Analysis of the porosity, (D) mean calcium content (CaMean) and (E) width of the distribution of mineralization levels (CaWidth) in WT and Hyp mice. (F) Bone mineral density distribution (BMDD) histograms of the mineralization of the mallei of WT (blue curve) and Hyp mice (red curve). (G, H) Quantification of the number (N.Ot.Lc/B.Ar) and mean area of osteocyte lacunae (Lc.Ar) in Hyp mice compared to WT. (I) μCT-image of the middle ear with focus on the stapes marked in red. (J) Representative qBEI images of the stapes in WT (left panel) and Hyp mice (right panel). (K) Quantification of the mean calcium content (CaMean) in Hyp mice compared to WT, (L) mineralization heterogeneity (CaWidth) and (M) the mean osteocyte lacunar area (Lc.Ar). ***p<0.001, ****p<0.0001 (two-tailed unpaired t-test).

