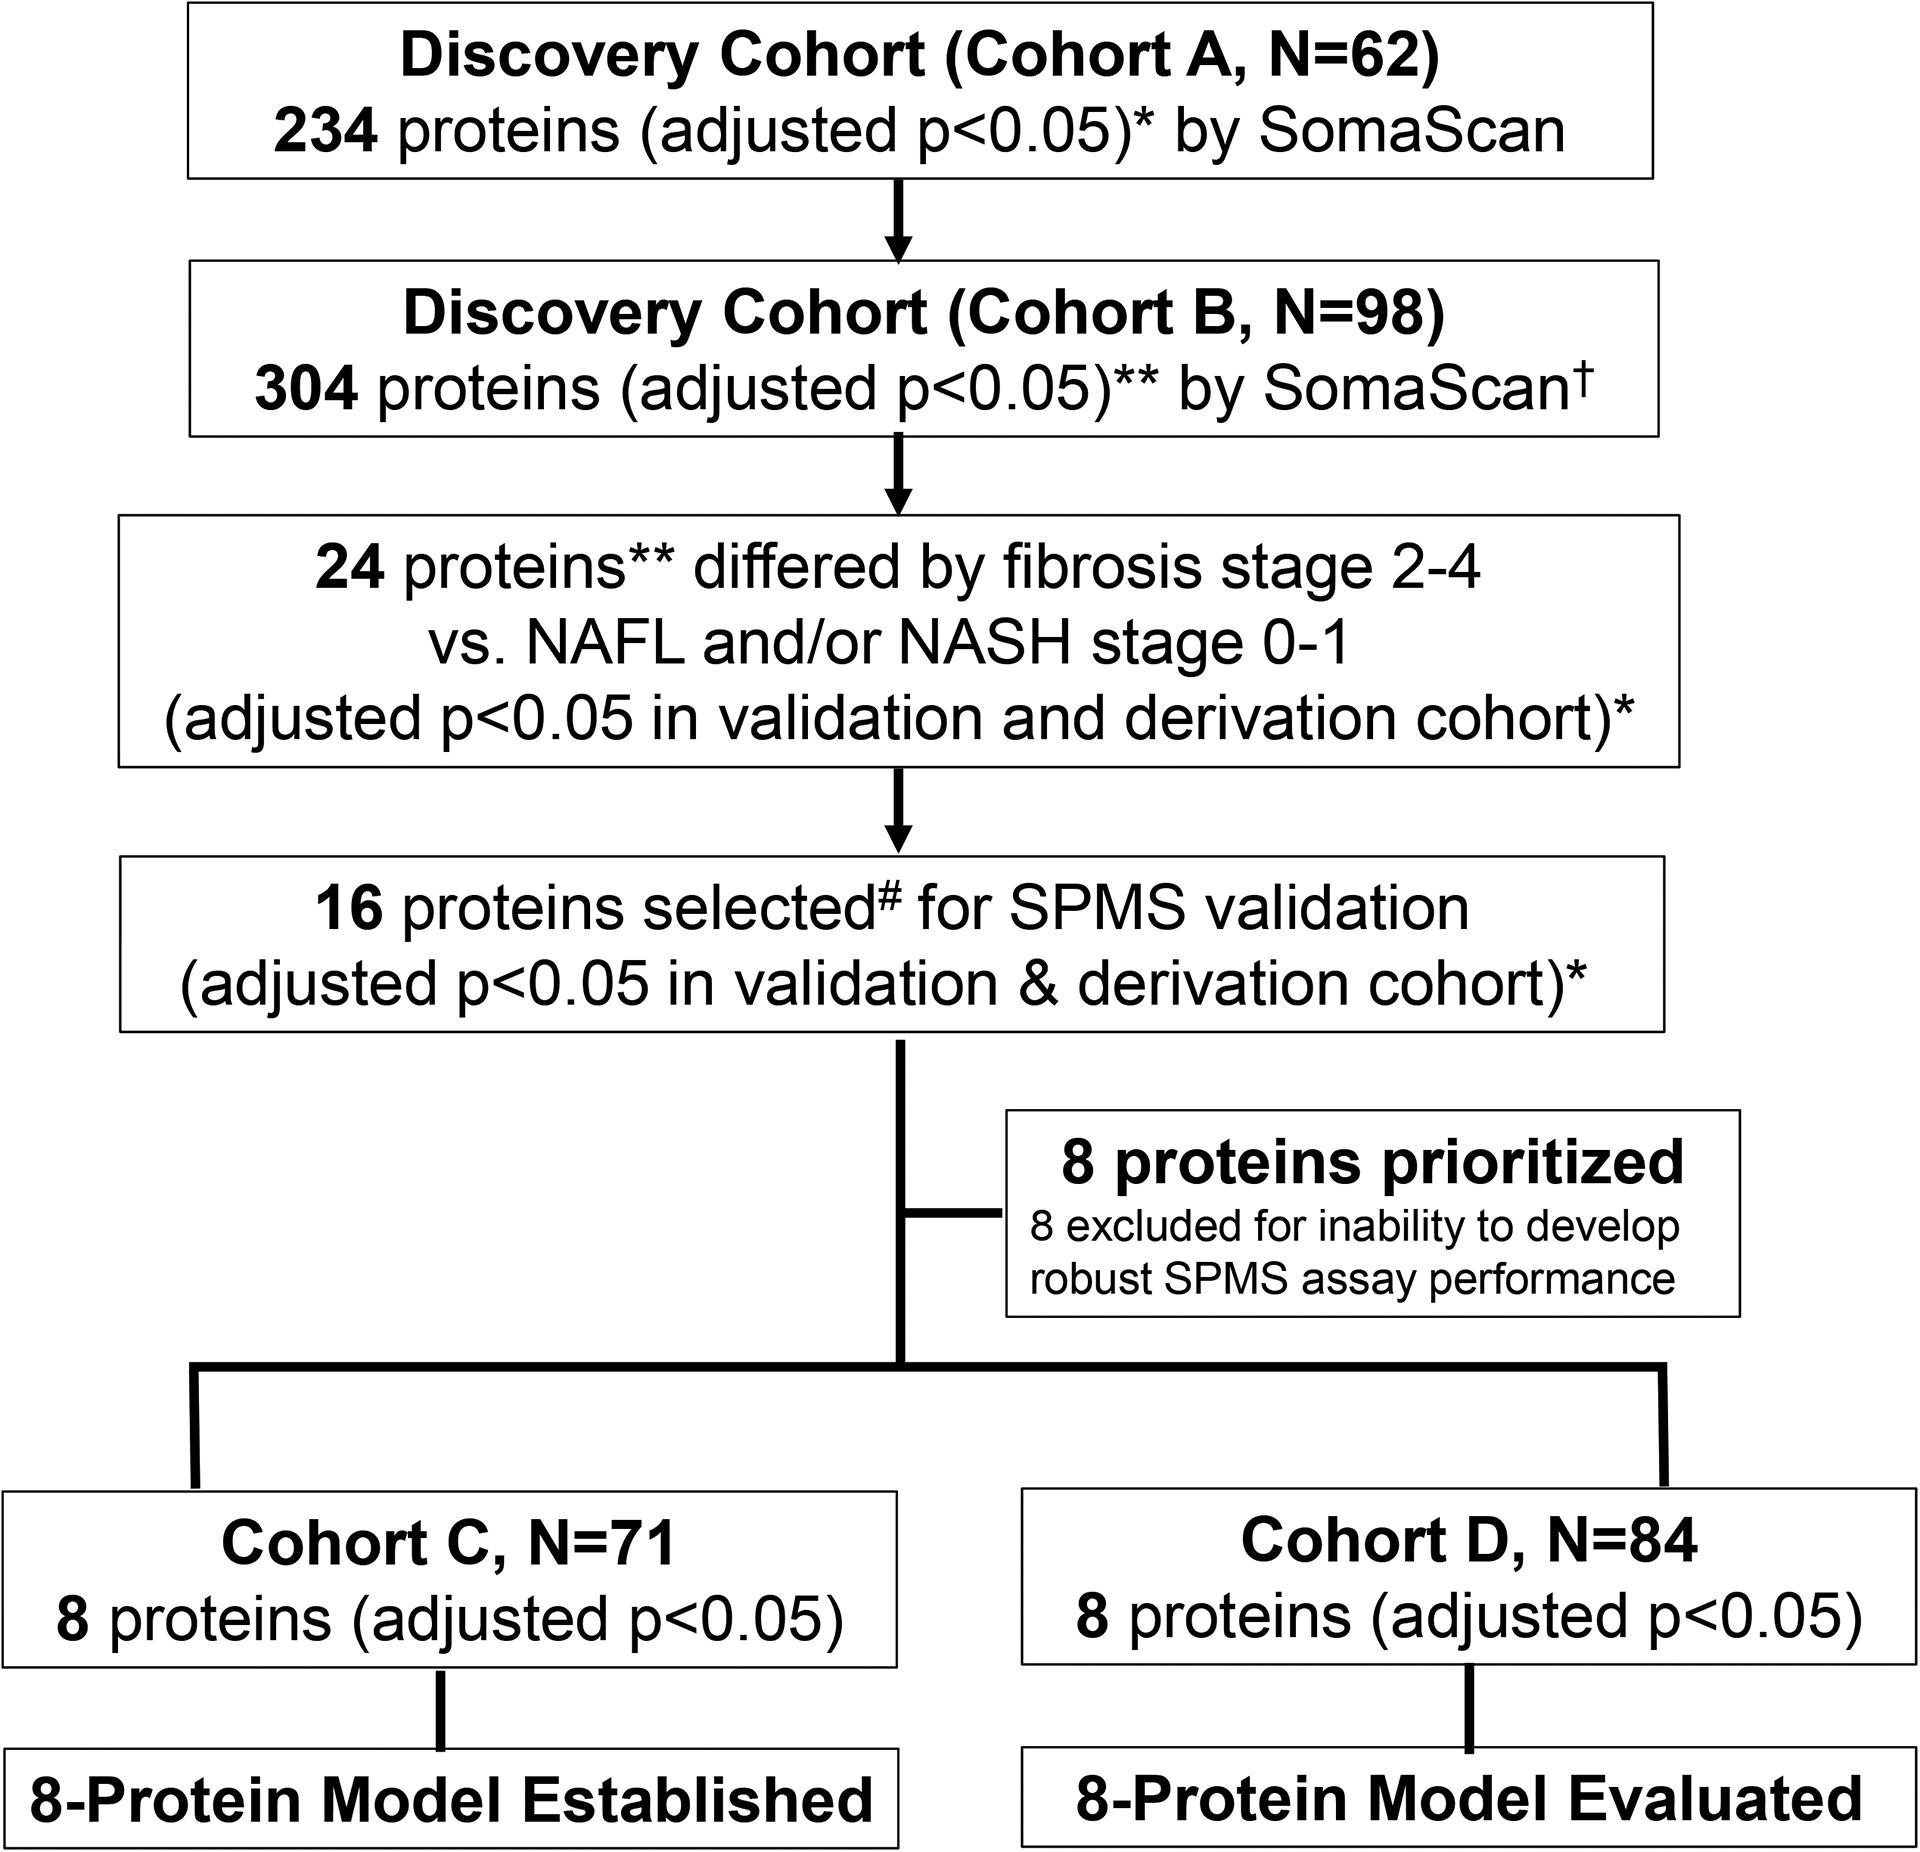
Figure 1:

Flow Diagram of Protein Selection for NAFLD Fibrosis Protein Panel.
* P value adjusted for FDR multiple hypothesis testing
** ADAMTSL2 adjusted p=0.08 in Cohort B
# 16 proteins selected by effect size, consistent trends and directionality
† SomaScan measures relative abundance of proteins, SPMS provides precise quantification of protein levels.
