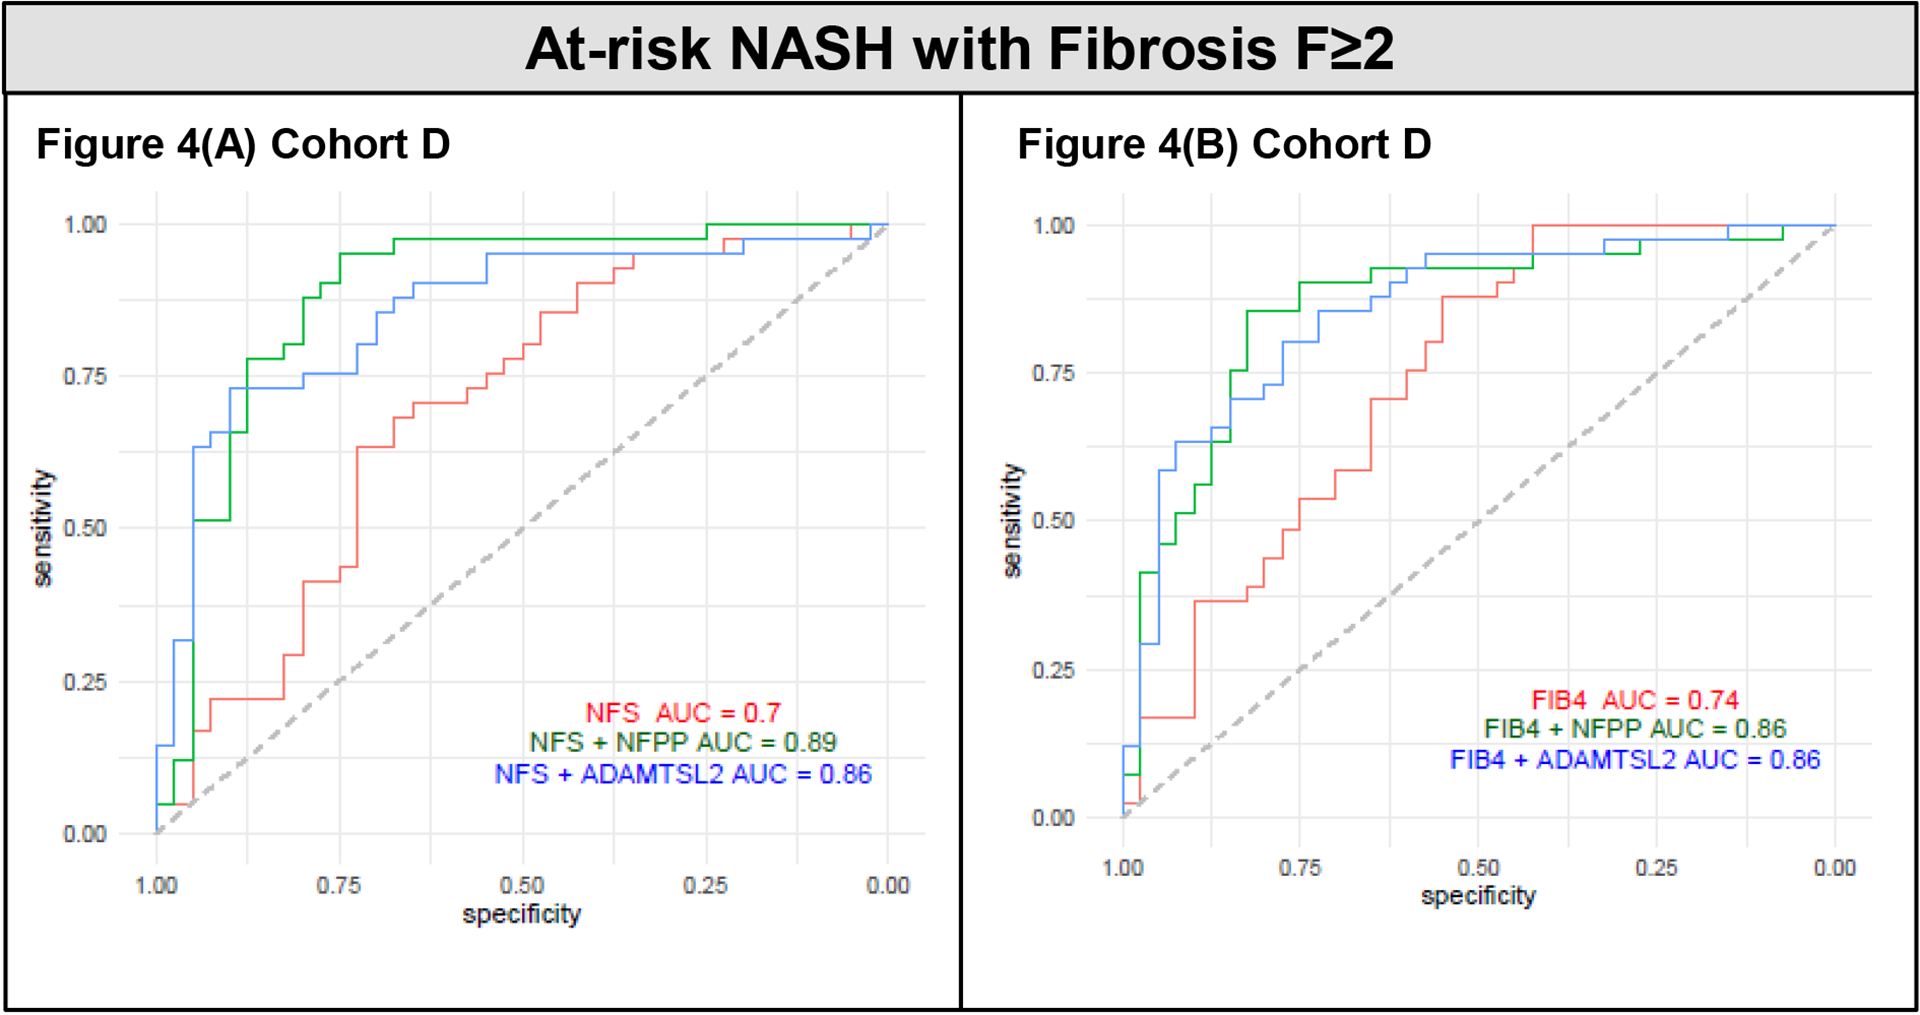
Figure 4. ROC curves of the NAFLD Fibrosis Score (NFS) and Fibrosis-4 (FIB-4) score with the addition of ADAMTSL2 and the NAFLD Fibrosis Protein Panel (NFPP) for the identification of at-risk NASH in Cohort D.

(A) NFS AUROC = 0.70 (95% CI 0.53–0.75), NFS plus ADAMTSL2 AUROC = 0.86 (95% CI 0.64–0.84), and NFS plus NFPP AUROC = 0.89 (95% CI 0.73–0.90). (B) FIB-4 AUROC = 0.74 (95% CI 0.60–0.81), FIB-4 plus ADAMTSL2 AUROC = 0.86 (95% CI 0.69–0.87), and FIB-4 plus NFPP AUROC = 0.86 (95% CI 0.73–0.90).
