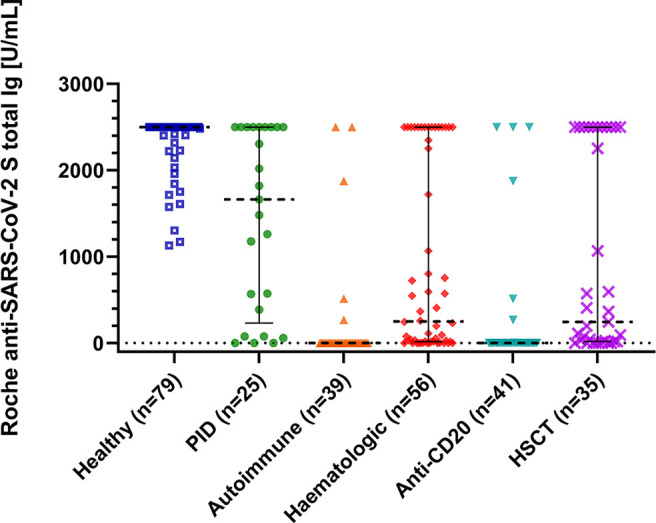
Figure 1.

Immune response to SARS-CoV-2 mRNA vaccination. The scatter plot shows total immunoglobulin levels for healthy controls, immunodeficient patients and patients after anti-CD20 therapy or hematopoietic stem cell transplantation (HSCT). P is <0.001 between all groups calculated with the Kruskal-Wallis test and post hoc analysis. Lines are medians with interquartile range. The Plot was drawn with GraphPad Prism Version 9.2.0.332.
