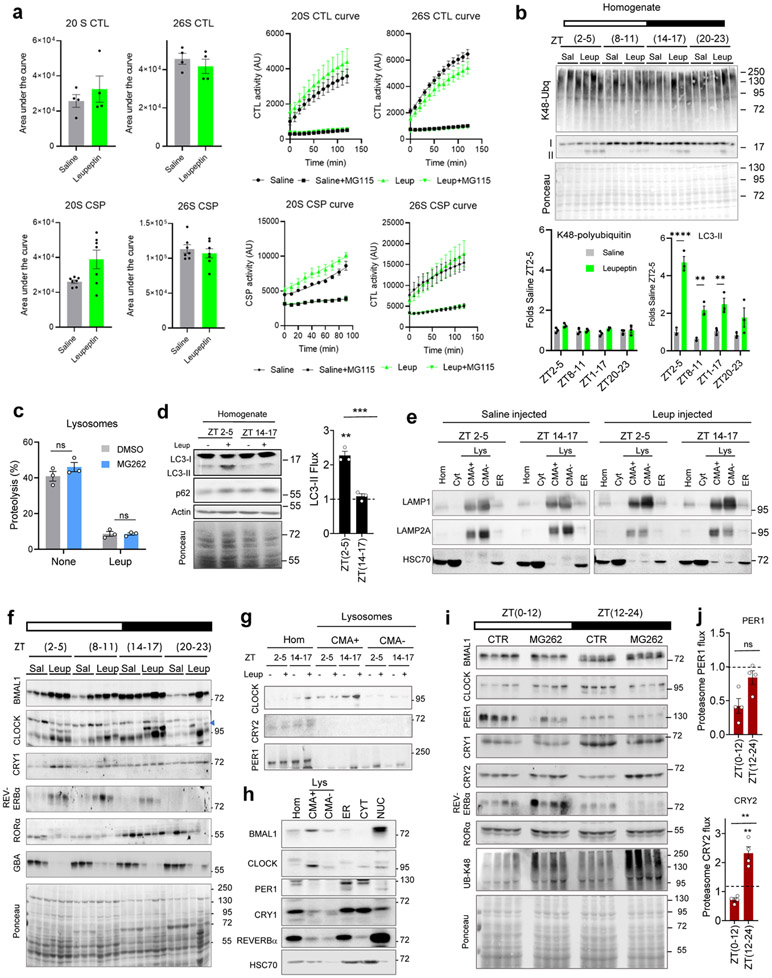
Extended Data Fig. 2. Circadian lysosomal and proteasomal protein degradation in liver.
a. Chymotrypsin-like (CTL) and caspase-like (CSP) activities of the 20S and 26S proteasome in livers from mice injected with saline (Sal) or leupeptin (Leup; 40mg/kg b.w.) 3h before tissue collection. Area under the curve after discounting residual MG115-resistent activity (left) and time-course kinetics (right) are shown. n=4 (CTL), 7 (CSP) mice. b. Top: Immunoblot from livers from mice treated as in a collected at the indicated Zeitgeber times (ZT). Ponceau staining is shown as loading control. Bottom: Levels of K48-polyubiquitinated proteins (left) and LC3-II (right) relative to ZT2-5 saline injected. n=3 mice per ZT and treatment. c. Proteolytic activity of liver lysosomes from mice injected with MG262 in 60% dimethyl sulfoxide (DMSO) or only DMSO (control; CTR) and incubated with a pool of radiolabeled proteins with or without leupeptin. n=3 mice per treatment. d. Left: Representative immunoblot of homogenate of mice injected (+) or not (−) with leupeptin (leup) as in a. Right: LC3-II flux (fold increase upon leupeptin injection). n=3 mice per ZT. e-g. Immunoblot of liver homogenates (Hom), lysosomes (Lys) active (+) or not (−) for CMA, ER, and cytosol (Cyt) (e), CMA+ lysosomes (f) and CMA+ and CMA (−) lysosomes (g) isolated from mice treated as in a. Loading controls for f are in e. h. Immunoblot of rat liver fractions at ZT17 to compare with ZT5 (Fig. 1b). i. Immunoblot of liver homogenates from mice treated as in c. UB-K48 is used as a control for efficacy of MG262 injection. j. Proteasome degradation of PER1 and CRY2 (>1.5 fold increase upon MG262 injection) at each time. n=4 mice per ZT. Dotted line: no degradation. Individual values (a-d,j) and mean+s.e.m are shown. Unpaired t-test (a left) and Two-way ANOVA followed by Sidak (a right, b and c) or Bonferroni’s (c, d, j) multiple comparisons post-hoc tests were used Differences were significant for *p<0.05, **p<0.01, ***p<0.001 and ****p<0.0001. ns=not significant. Numerical source data, statistics and exact p values and unprocessed blots are available as source data.

