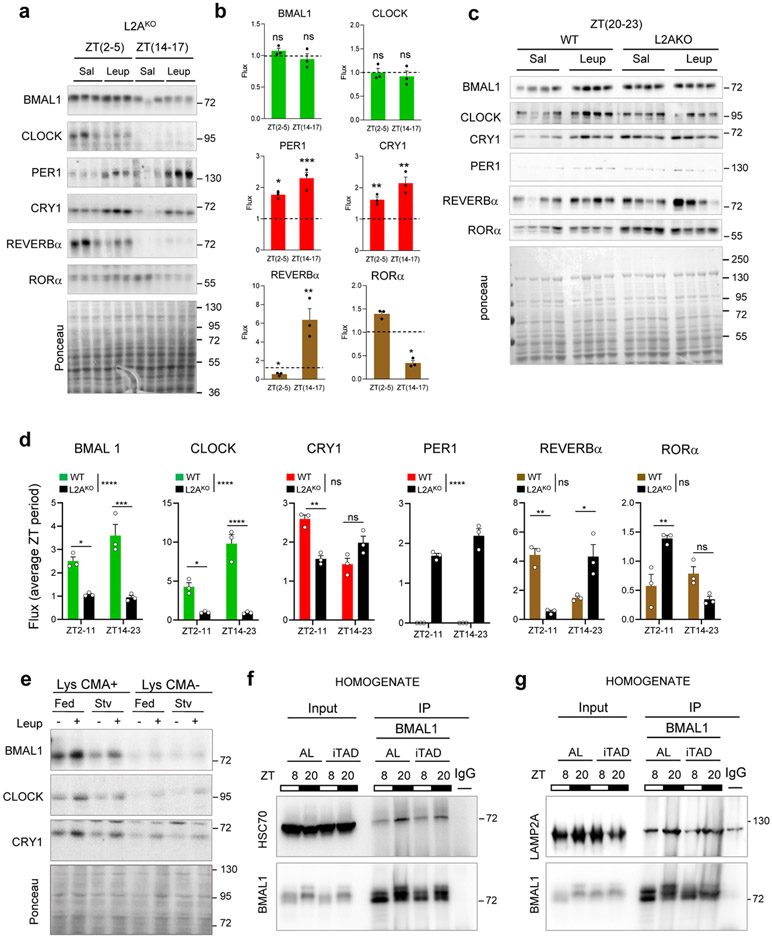
Extended Data Fig. 3. Lysosomal degradation of clock proteins is dependent on CMA but independent of the nutritional status.
a. Immunoblot of liver homogenates from LAMP2A knockout mice (L2AKO) intraperitoneally injected (i.p.) with saline (Sal) or a single dose of leupeptin 3h before tissue collection at the indicated circadian times (ZT). b. Lysosomal flux for the indicated circadian proteins calculated as the increase in >1.5 folds above the dotted line (value 1) upon leupeptin injection. n=3 mice per ZT. c. Immunoblot of livers from WT and L2AKO mice treated as in a and collected at ZT(20-23), time of maximal BMAL1 and CLOCK lysosomal degradation, and run in the same membrane for comparative purposes. d. Lysosomal flux for the indicated proteins in WT and L2AKO mice livers from blots in Extended Data Fig. 2f and 3a,c. n=3 mice per ZT and genotype. A lane with the same sample in all gels was used for normalization across membranes. Note that PER1 was not detected in WT lysosomes (Extended Data Fig. 2g). e. Immunoblot for the indicated proteins in CMA-active lysosomes (Lys CMA+) and CMA-inactive lysosomes (Lys CMA−) from mice fed ad libitum or starved for 24h (Stv) and injected or not with leupeptin. A representative immunoblot is shown (the experiment was replicated 3 times). f,g. Immunoblot for HSC70 (f) and LAMP2A (g) of BMAL1 immunoprecipitated (IP) from liver homogenates of mice fed ad libitum (AL) or maintained in an isocaloric twice-a-day feeding (iTAD) during the light time for 6 months collected at ZT8 and ZT20. The experiment was repeated 3 times. Individual values and mean+s.e.m are shown. Two-way ANOVA followed by Bonferroni's multiple comparisons post-hoc test was used to determine differences in protein flux at each time in L2AKO mice (b) and differences between genotypes (d). Differences in flux between both ZT are shown in the legend and between genotypes on top of the bars. Absolute protein levels are included in the raw data file. *p<0.05, **p<0.01, ***p<0.001 and ****p<0.0001. ns = not significant. Numerical source data, statistics and exact p values and unprocessed blots are available as source data.

