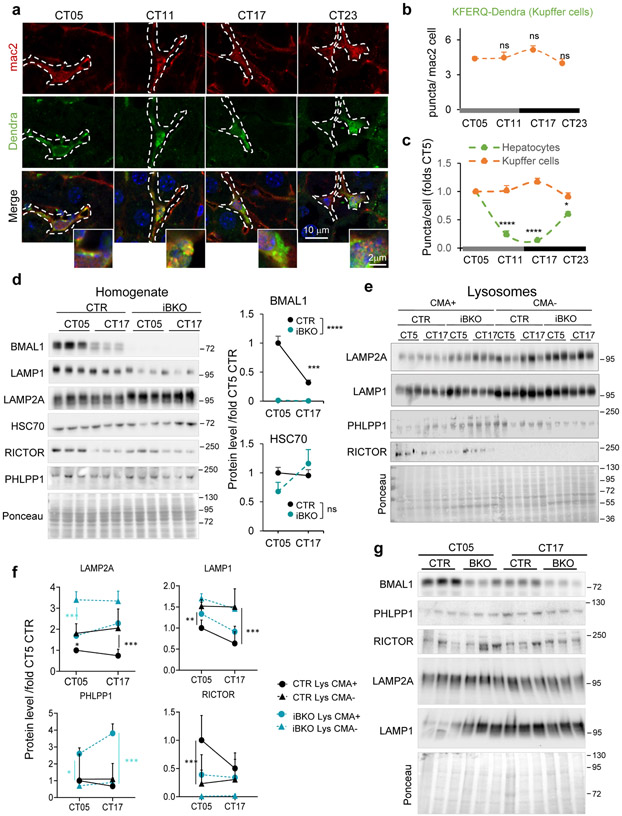
Extended Data Fig. 8. Cell-type and tissue-specific changes in hepatic CMA activity during the light/dark cycle in different liver cells.
a. Immunofluorescence for Dendra and mac2 (to label hepatic Kupffer cells) in liver sections from KFERQ-Dendra mice at the indicated circadian times (CT). Nuclei are highlighted with Hoechst. Individual and merged channels are shown. Insets: higher magnification images. Dotted white line: Kupffer cells profile. b. Quantification of Dendra+ puncta per mac2+ cell section. n=3 mice per CT (50 cells were quantified per mouse and the mean value of puncta per cell in each mouse was used for statistics). c. Quantification of temporal changes in Dendra+ puncta number in hepatocytes and Kupffer cells relative to CT05 values (arbitrary value of 1). n=3 mice per CT (65 cells of each type were quantified per mouse and the mean value of puncta per cell in each mouse was used for statistics). d. Immunoblot of homogenate from control (CTR) and BMAL1 knockout (iBKO) mice livers at two circadian times (CT). Ponceau staining is shown as loading control. Right: Quantification of BMAL1 and HSC70, n=3 mice per CT and genotype. e,f. Immunoblot of lysosomes active (+) or inactive (−) for CMA isolated from livers of CTR and iBKO mice (e). Ponceau staining is shown as loading control. Quantification of immunoblots as the ones shown in e (f). n = 6 (CTR) and 3 (iBKO) mice per CT. g. Immunoblot for the indicated proteins in homogenate from kidneys of control (CTR) and BMAL1 knockout (iBKO) mice at two circadian times (CT). Three mice per condition are shown. Ponceau staining is shown as loading control. All values are mean+s.e.m. One-way ANOVA test followed by Tukey HSD post-hoc tests (b) or two-way ANOVA test followed by Bonferroni’s (c) or Tukey’s (d,f) (post-hoc tests for multiple variable comparisons were used. Significant differences between genotypes are shown in the legend and between times in the graph in d. Significant differences between CMA+ and CMA− lysosomes for each genotype are marked in the graph in f and between lysosomes, times and genotype are summarized in the raw data file. *p<0.05, **p<0.01, ***p<0.001 and ****p<0.0001. ns = not significant. Numerical source data, statistics and exact p values and unprocessed blots are available as source data.

