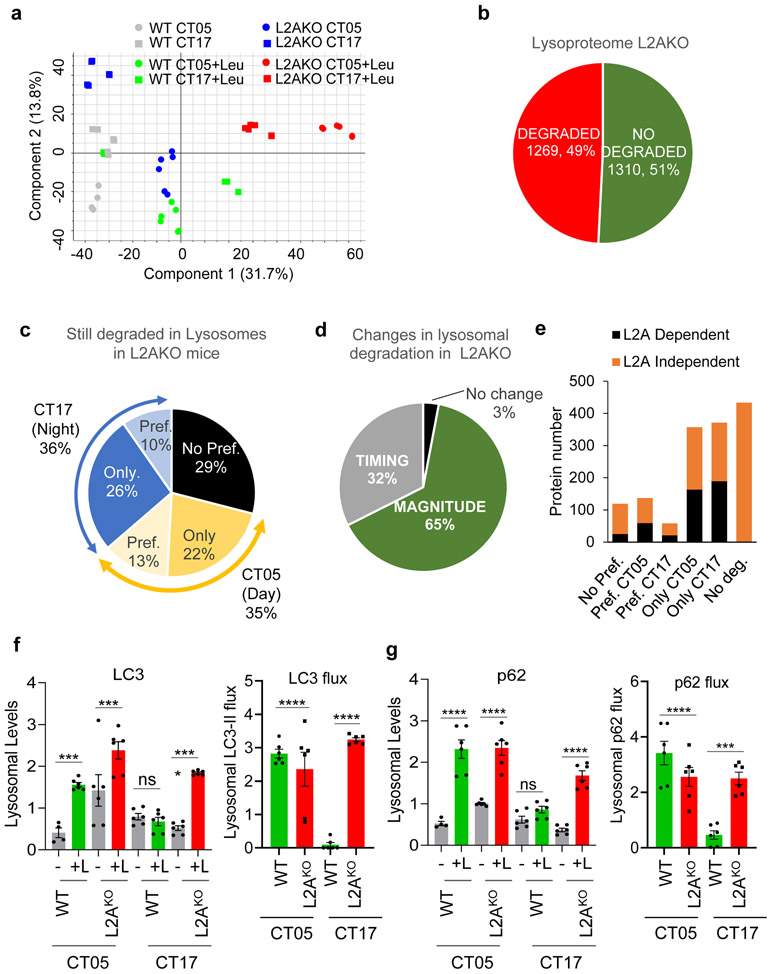
Extended Data Fig. 9. Changes in the cyclic degradation of macroautophagy components upon CMA blockage.
Comparative differential proteomics of lysosomes from livers of wild-type (WT) or LAMP2A knockout mice (L2AKO) injected or not with leupeptin (Leu) and isolated at circadian time CT05 (day) or CT17 (night). All values are from n=3 mice per CT, genotype and treatment group. a. Principal component analysis showing the multivariate variation among the different genotype, time, and treatment groups. b. Percentage and number of proteins undergoing or not lysosomal degradation (increase upon leupeptin treatment). c. Preferences in degradation time of the subset of proteins degraded in lysosomes from L2AKO mice. d. Percentage of proteins in lysosomes from L2AKO mice displaying changes in their rate (magnitude) or time (timing) of degradation. e. Number of proteins in lysosomes according to their preference in degradation time and their dependence on the presence of LAMP2A in lysosomes. f,g. Lysosomal degradation of macroautophagy proteins LC3 (f) and p62 (g) calculated from the proteomic data. Graphs show quantification of levels of each of the proteins in lysosomes isolated from mice untreated (−) or injected with leupeptin (+L) (left) and lysosomal flux for both proteins calculated as differences in their lysosomal abundance between untreated or leupeptin injected mice (right). n=3 mice per CT, genotype and treatment with technical replicates for each one. Individual values per mouse (f,g) and mean+s.e.m are shown. Two-way ANOVA test followed by Bonferroni’s (f, g) post-hoc test (for multiple variable comparisons) was used. Differences were significant for ***p<0.001 and ****p<0.0001. ns = not significant. Numerical source data, statistics and exact p values are available as source data.

