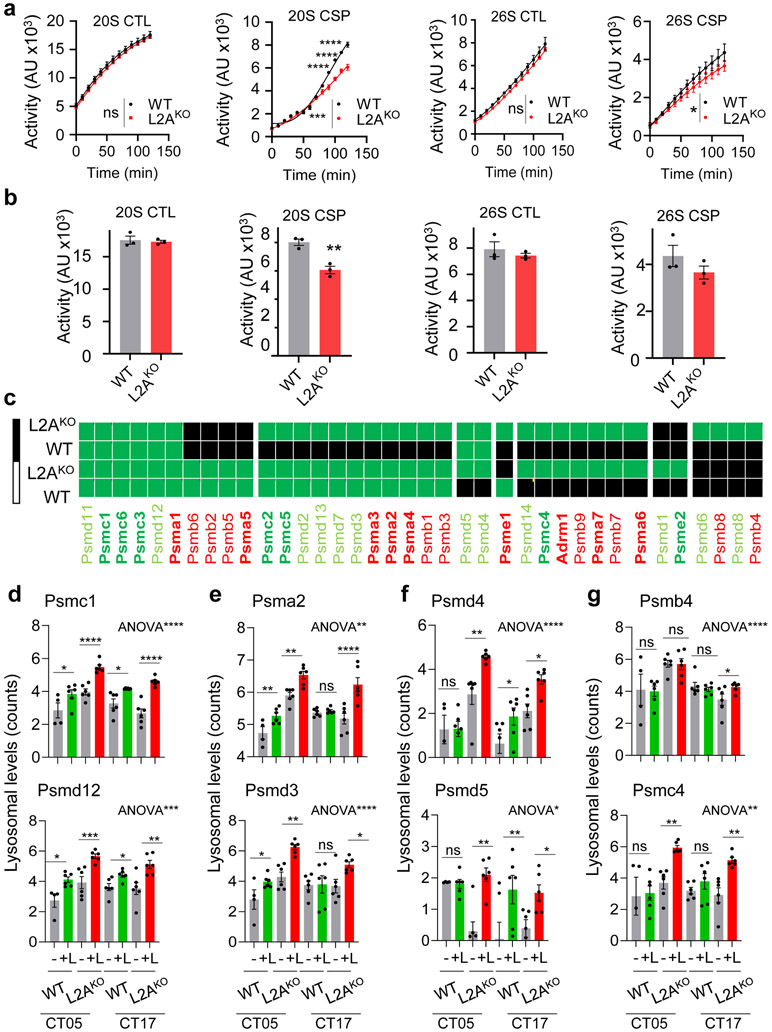
Extended Data Fig. 10. Changes in proteasome components upon CMA blockage.
a, b. Chymotrypsin-like (CTL) and caspase-like (CSP) activities of the 20S and 26S proteasome in livers from WT or L2AKO mice. Time-course kinetics (a) and area under the curve (b) are shown. n=3 mice per genotype in a and b. c-g. Lysosomal degradation of proteasome subunits in the same mice. c shows heatmaps of degradation (green) or not (black) at the two time points and d-g shows changes in lysosomal levels of the indicated proteasome proteins as representative examples of the 4 identified patterns: subunits with comparable degradation and cycling in WT and L2AKO mice (d), subunits preferentially degraded during the day (e) or during the night (f) in WT mice that become continuously degraded in L2AKO mice, and subunits normally not degraded in lysosomes that become now lysosomal substrates (g). n=3 mice per CT, genotype and treatment with technical replicates for each one. Individual values per mouse and mean+s.e.m are shown. Two-way ANOVA test followed by Bonferroni’s (a) or Sidak’s (d-g) post-hoc tests (for multiple variable comparisons), and two-sided unpaired T-test (b) were used. Differences were significant for *p<0.05, **p<0.01, ***p<0.001 and ****p<0.0001. ns = not significant. Numerical source data, statistics and exact p values are available as source data.

