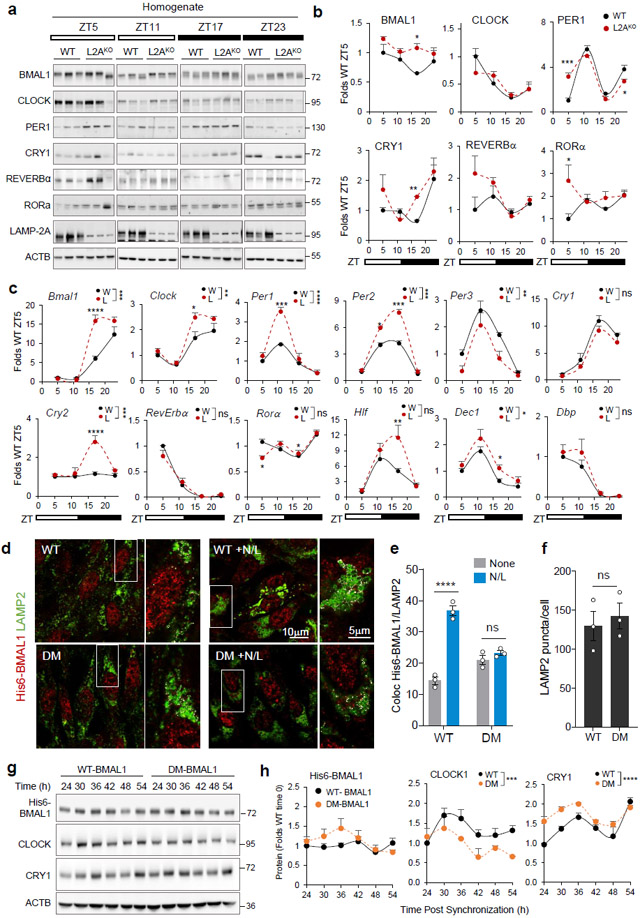
Fig. 2. Blockage of CMA disrupts the molecular clock.
a, Immunoblot of wild-type (WT, W) and LAMP2A knockout mice (L2AKO, L) livers collected at the indicated Zeitgeber times (ZT). Actin is shown as loading control, and LAMP2A to confirm KO. (Note: the anti-L2A antibody recognizes a non-specific protein in liver30, 31). ZT5 and ZT17 samples and ZT11 and ZT23 samples were run in the same membrane and all membranes contained a common sample for normalization across membranes. b, Temporal changes of clock proteins in a expressed as fold levels in WT at ZT5. n=3 mice per ZT and genotype. c, Temporal changes in clock components mRNA levels in the same animal groups as a. Values were normalized to TBP as housekeeping gene and are expressed as fold levels in WT at ZT5. n=3 mice per ZT and genotype. d, Immunofluorescence for LAMP2 (green) and His6 tag (red) in NIH3T3 cells stably expressing wild-type (WT) BMAL1 histidine tagged (His6) or the same protein mutated in its two CMA-targeting motifs (DM). Where indicated 20mM NH4Cl, 100μM leupeptin (N/L) was added to prevent lysosomal proteolysis. Insets: boxed area with colocalized pixels (white) at higher magnification. e, f, Fraction of His6-BMAL1 colocalizing with LAMP2 (Mander’s Coefficient - M1) (e) and average number of LAMP2 fluorescent puncta (f) in cells as in d. n=3 independent experiments (30 cells were quantified per experiment and the mean value of puncta per cell per experiment was used for statistics). g, Immunoblot for clock elements in cells expressing WT or DM-BMAL1 collected at the indicated times after dexamethasone-synchronization. Actin is shown as loading control. h, Levels of the indicated clock elements in experiments as in g. n=4 independent experiments. Individual values (e,f) and mean±s.e.m are shown. Unpaired two tailed t test was used in f and two-way ANOVA followed by Bonferroni’s multiple comparison post-hoc tests in b, c, e and h. Significant differences by genotype or mutation are indicated in the legends in c and g, respectively. Differences were significant for *p<0.05, **p<0.01, ***p<0.001 and ****p<0.0001. ns = not significant. Numerical source data, statistics and exact p values and unprocessed blots are available as source data.

