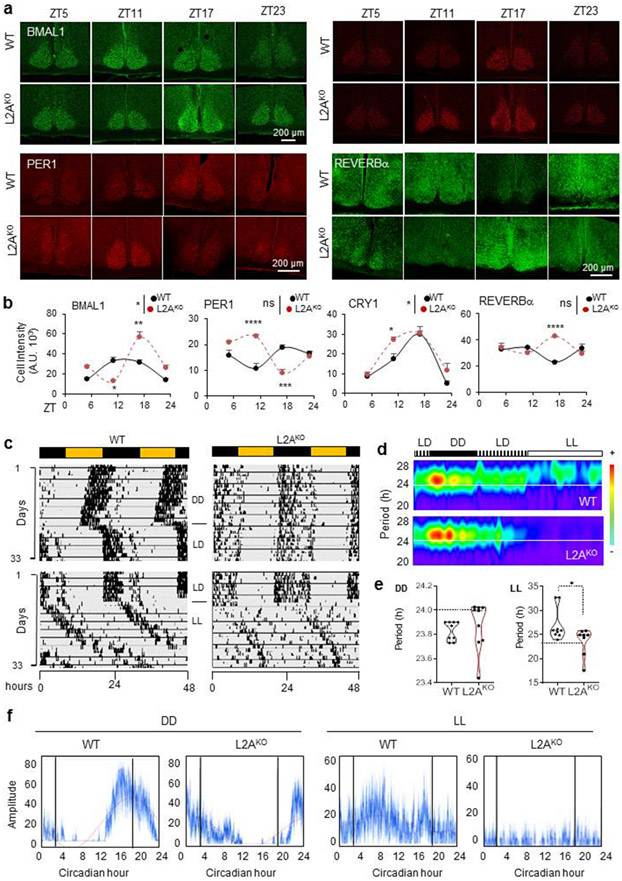
Fig. 3. CMA-defective mice display disturbances in circadian patterns.
a, Immunostaining for BMAL1, PER1, CRY1 and REVERBα in the suprachiasmatic nucleus region (SCN) of brains of wild-type (WT) or LAMP2A knockout mice (L2AKO) at the indicated Zeitgeber times (ZT). b, Quantification of the average fluorescent intensity per cell in the SCN area in images as the ones shown in a. n=3 mice per ZT and genotype. c, Double-plotted actograms of WT and L2AKO mice subjected to the light manipulations indicated in the middle for the number of days indicated on the left. LD, 12:12 light:dark; DD, continuous dark; LL, continuous light. d, Representative Morlet Wavelet of WT and L2AKO mice under the same conditions as in c. e, Average free running circadian period in the DD (left) and LL (right) cycles. n=9 WT mice per condition and 9 (for DD) and 8 (for LL) L2AKO mice. f, Representative activity profile of WT and L2AKO mice for an average 10 cycle in DD (left) or LL (right). The red line is a sine-fit to the waveform indicating the rhythm of these mice. Individual values (e) and mean±s.e.m are shown. Unpaired two-tailed t test was used in e and two-way ANOVA test followed by Bonferroni’s multiple comparisons test post-hoc test was used for b. Significant differences by genotype across the ZT are shown in the legends. Differences were significant for *p<0.05, **p<0.01 and ****p<0.0001. ns = not significant. Numerical source data, statistics and exact p values are available as source data.

