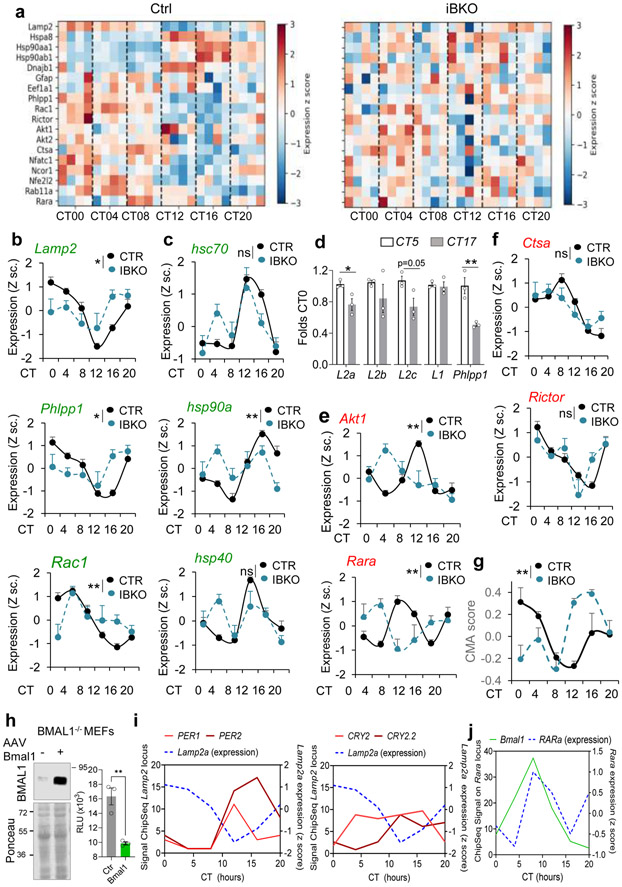
Fig. 5. BMAL1 regulates circadian CMA activity in liver at the transcriptional level.
a, Heatmap of the transcriptional activity of CMA-related genes from RNA-seq data of livers from control mice (CTR) and mice knockout for BMAL1 (iBKO) kept under constant darkness36. b-f, Normalized expression of known CMA effectors (b and c) and negative regulators (e and f), from the mice in a. n=4 mice per CT and genotype (in b,c,e,f and g). mRNA levels for the indicated spliced variants of Lamp2 in livers of mice at the circadian times of maximal and minimal CMA activity (d). Transcription changes for Lamp1 as an example of other lysosomal membrane proteins and PHLPP1 as a positive control of cycling genes are shown. Values are expressed relative to those in CT5 (arbitrary value of 1). n=3 mice per CT. g, CMA activation score in the same animals as in a, calculated from the transcriptional expression of the components of the CMA network. n=3 mice per CT and genotype. h, Lamp2a promoter expression in Bmal1-deficient MEFs co-transfected with a Lamp2a promoter luciferase reporter plasmid and a control plasmid or a plasmid overexpressing Bmal1 (+). Immunoblot for BMAL1 in the transfected cells (left) and luciferase activity measured 16h post-transfection (right). Values are expressed as relative luciferase units (RLU). n=3 independent experiments. i, Binding of the negative circadian elements PER1, 2 (left) and CRY2 (two binding sites) to the lamp2 locus in mouse liver. Signals for ChipSeq experiments as reported in56 at different time points. Expression of Lamp2a at the same times is shown as blue discontinuous line. j, Binding of Bmal1 to the RARα locus in mouse liver. Signals for ChipSeq experiments as reported in56 at different time points. Expression of RARα at the same times is shown as blue discontinuous line, n=3 mice per CT in i and j. Individual values (d,h) and mean±s.e.m are shown. Two-way ANOVA test to determine significance of the interaction between time and genotype (b,c,e,f,g) and unpaired two tailed t test (d, h) were used. *p<0.05, **p<0.01. ns = not significant. Numerical source data, statistics and exact p values and unprocessed blots are available as source data.

