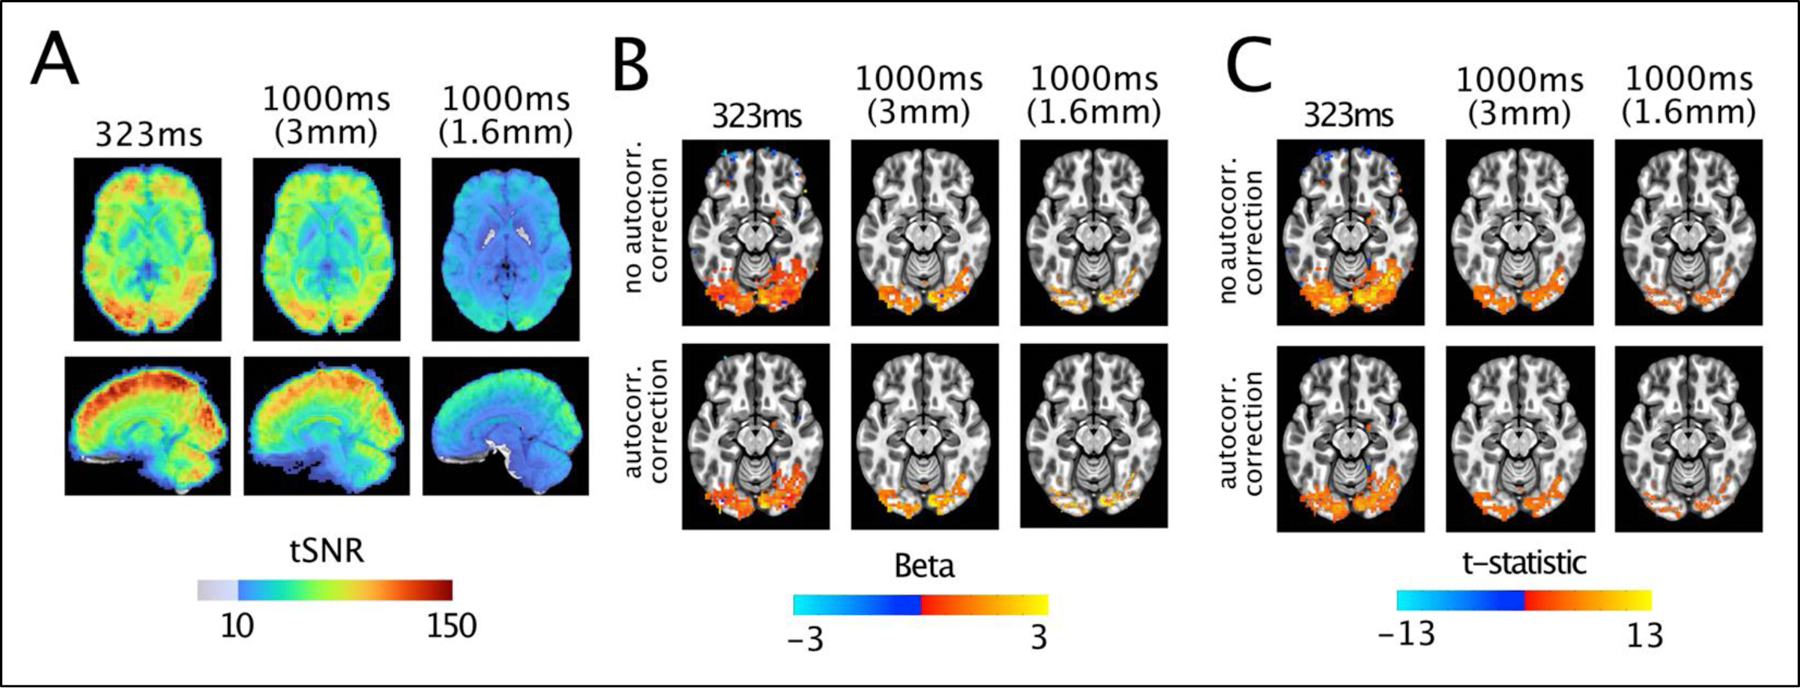
Figure 2. Characteristics of simulated 3 millimeter, 1000ms data.

A) tSNR measures, average over subjects. The simulated 3mm data show gains in tSNR, but remain below the peak obtained with a sampling rate of 323ms. B) Activation amplitudes (betas) for the nonzero phase face stimuli compared to baseline. The impact of autocorrelation on betas is minimal, with the simulated data showing a larger, but still relatively smaller extent of activation. D) T-statistics for the same contrast. The 1000ms data is again little changed by simulating 3mm data acquisition and the peak t-statistics remain larger in the data sampled at 323ms. For visualization purposes, the beta and t-statistic maps use a t threshold of p<0.01 from the average t-statistics of original 1000 and 323ms data are reproduced from Figure 1.
