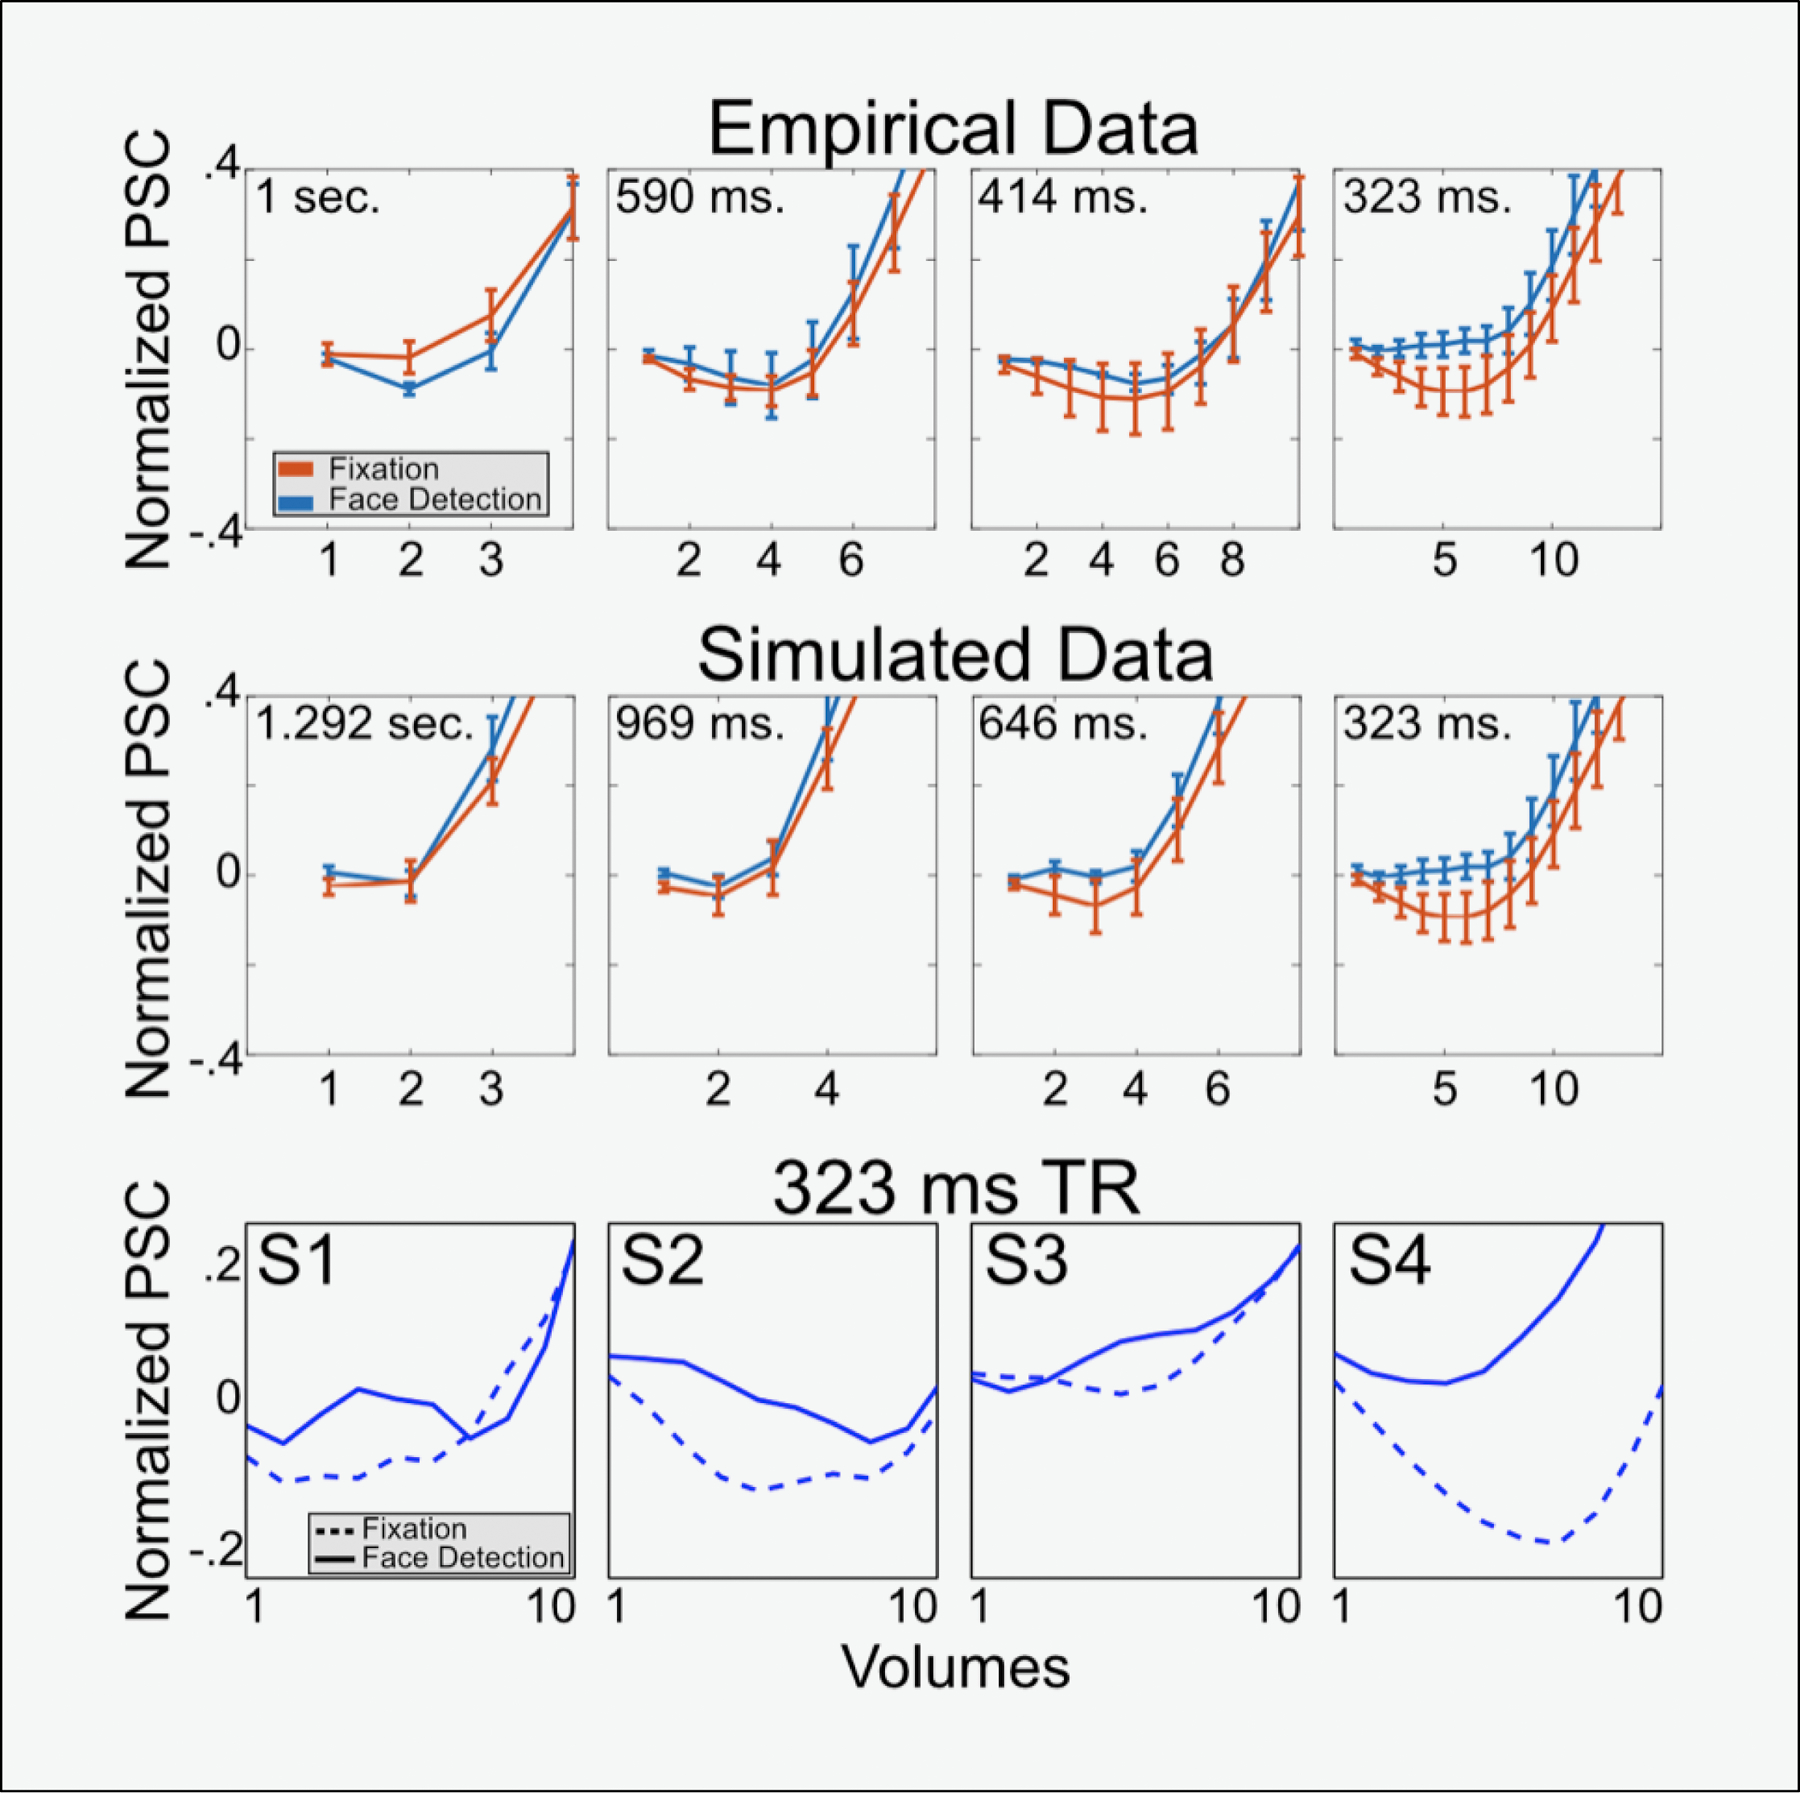
Figure 5. Clearer emergence of initial dip with sampling rate increases.

The top two panels illustrate how the initial dip becomes more pronounced as TR decreases. Specifically, task differences in the initial dip only emerge at the fastest sampling rate (i.e., 323ms TR). Both top panels zoom in the initial dip for the average FIRs across subjects and conditions elicited by both tasks in the visual cortex ROI, with error bars representing standard error across subjects. The top panel shows the initial responses in the empirical data for all resolutions (as portrayed in Figure 3). The middle panel instead shows downsampled data, simulating different TRs. Note the striking correspondence between empirical and simulated data. The bottom panel instead shows the first 10 volumes (i.e., 0 to 3.23 seconds after stimulus onset) for each single subject and for both tasks, only for the 323 ms TR data (i.e., the fastest temporal sampling), which the data set showing the earlies differences across tasks. Note how all subjects show an increased negativity for fixation compared to face detection.
