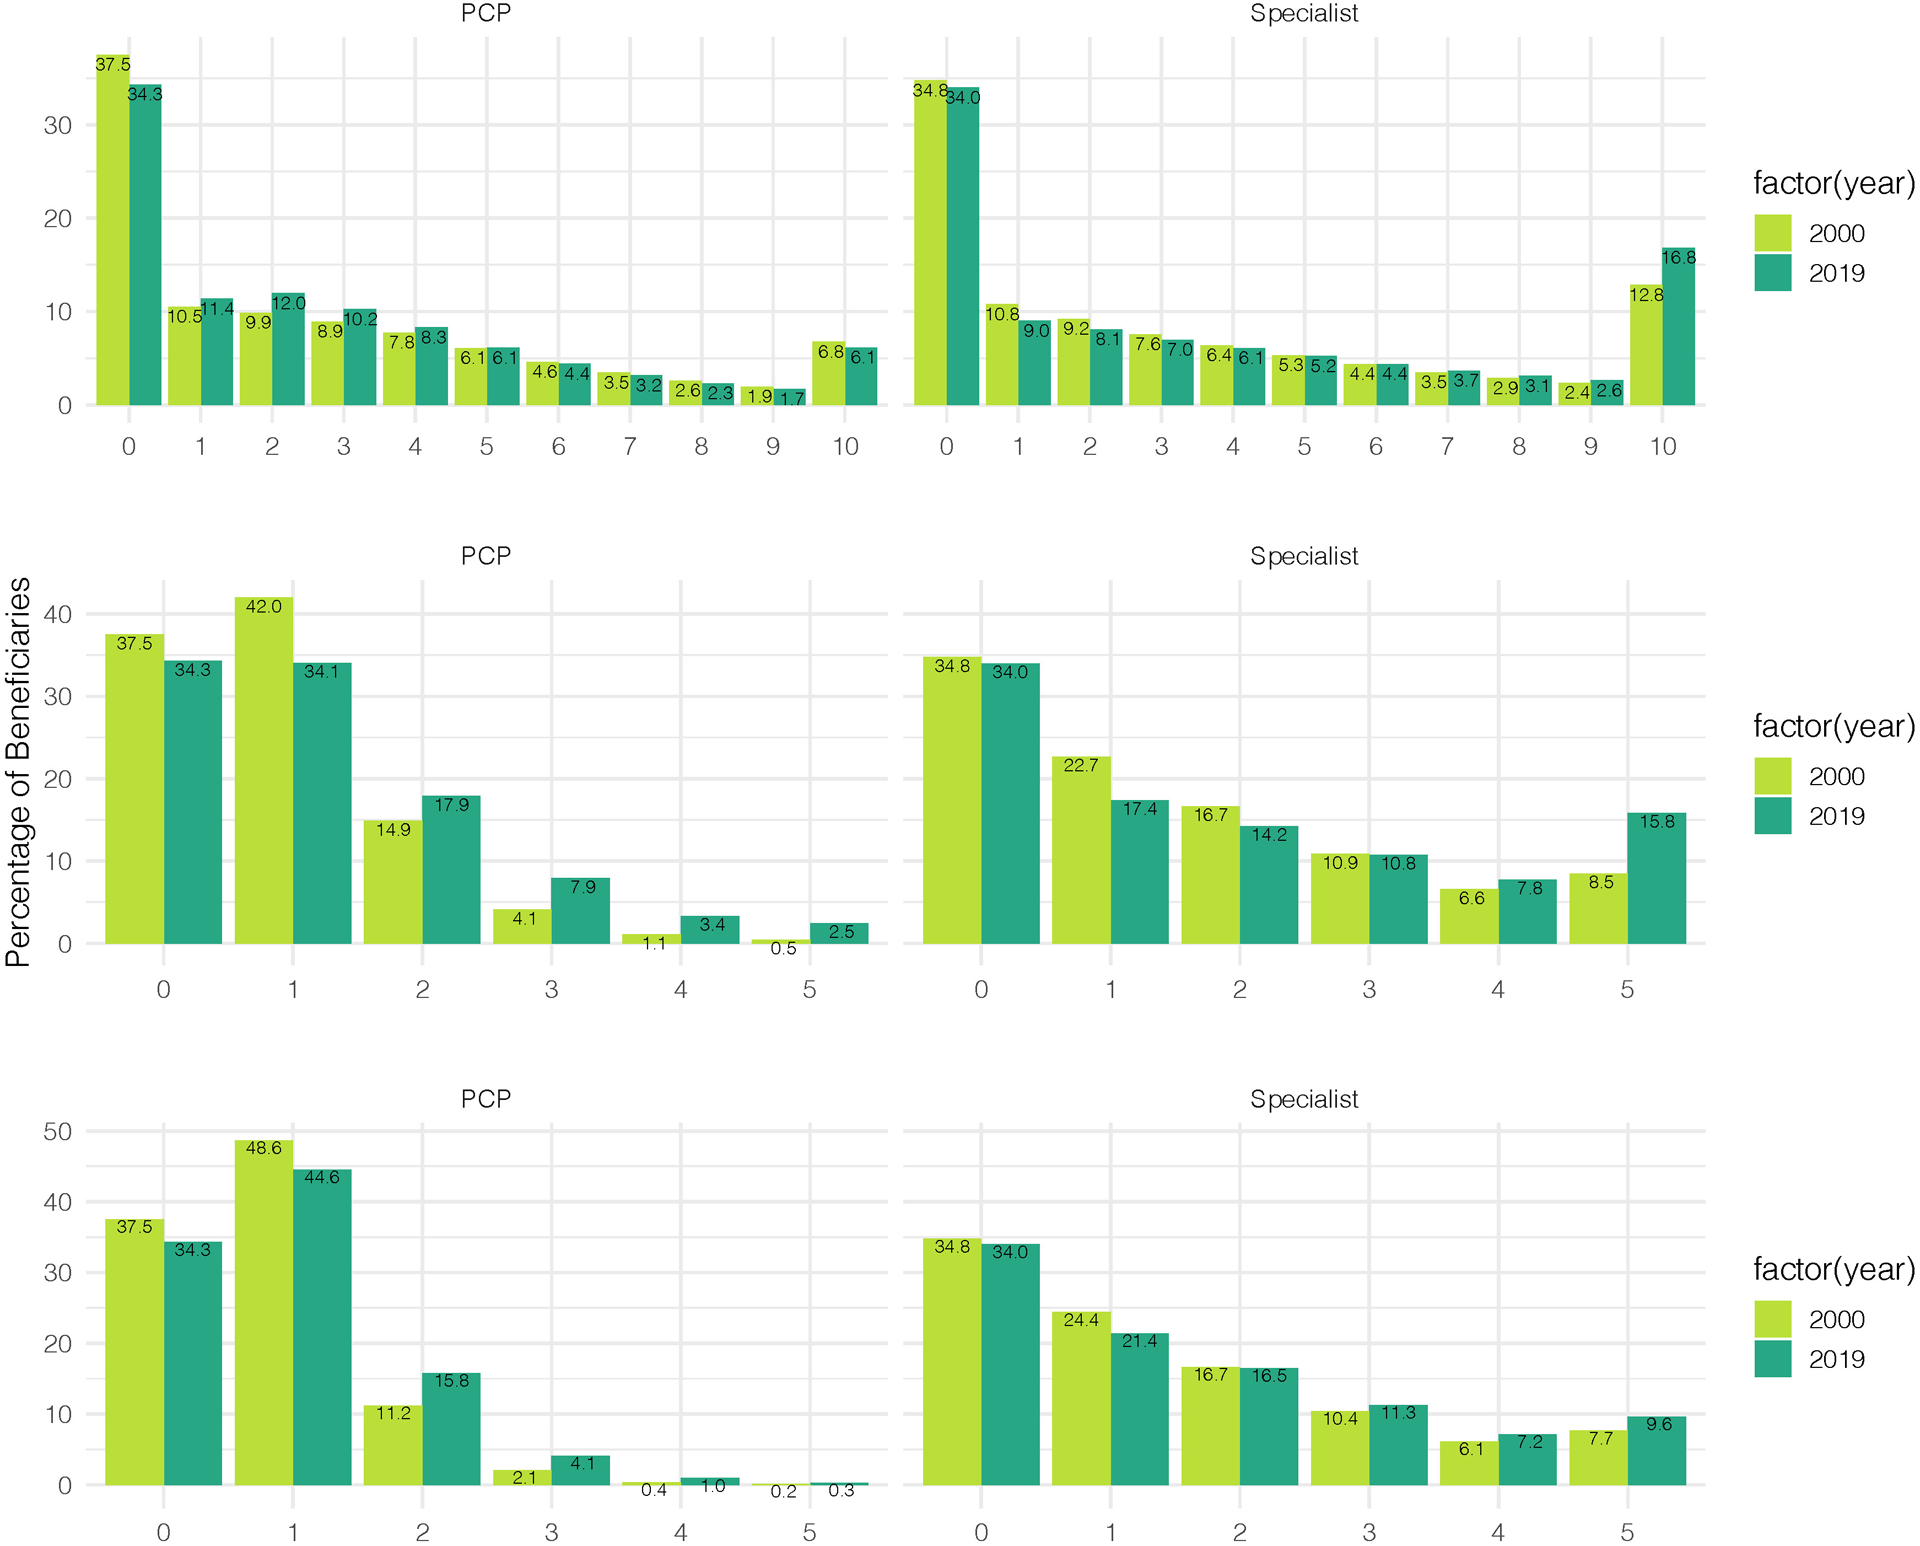
Figure 1: Patterns of Primary and Specialty Outpatient Care Use by Medicare Beneficiaries in 2000 and 2019.

Panel A shows the annual mean number of office visits with either PCPs or specialist physicians per Medicare beneficiary in 2000–2019. Panel B shows the percentage of Medicare beneficiaries with any physician visit in 2000–2019. Panel C shows the annual mean number of distinct PCPs or specialists seen per Medicare beneficiary over the same period. Panel D shows the annual mean number of office visits with PCPs or specialists per Medicare beneficiary with any PCP or specialist visit, respectively, over the same period
