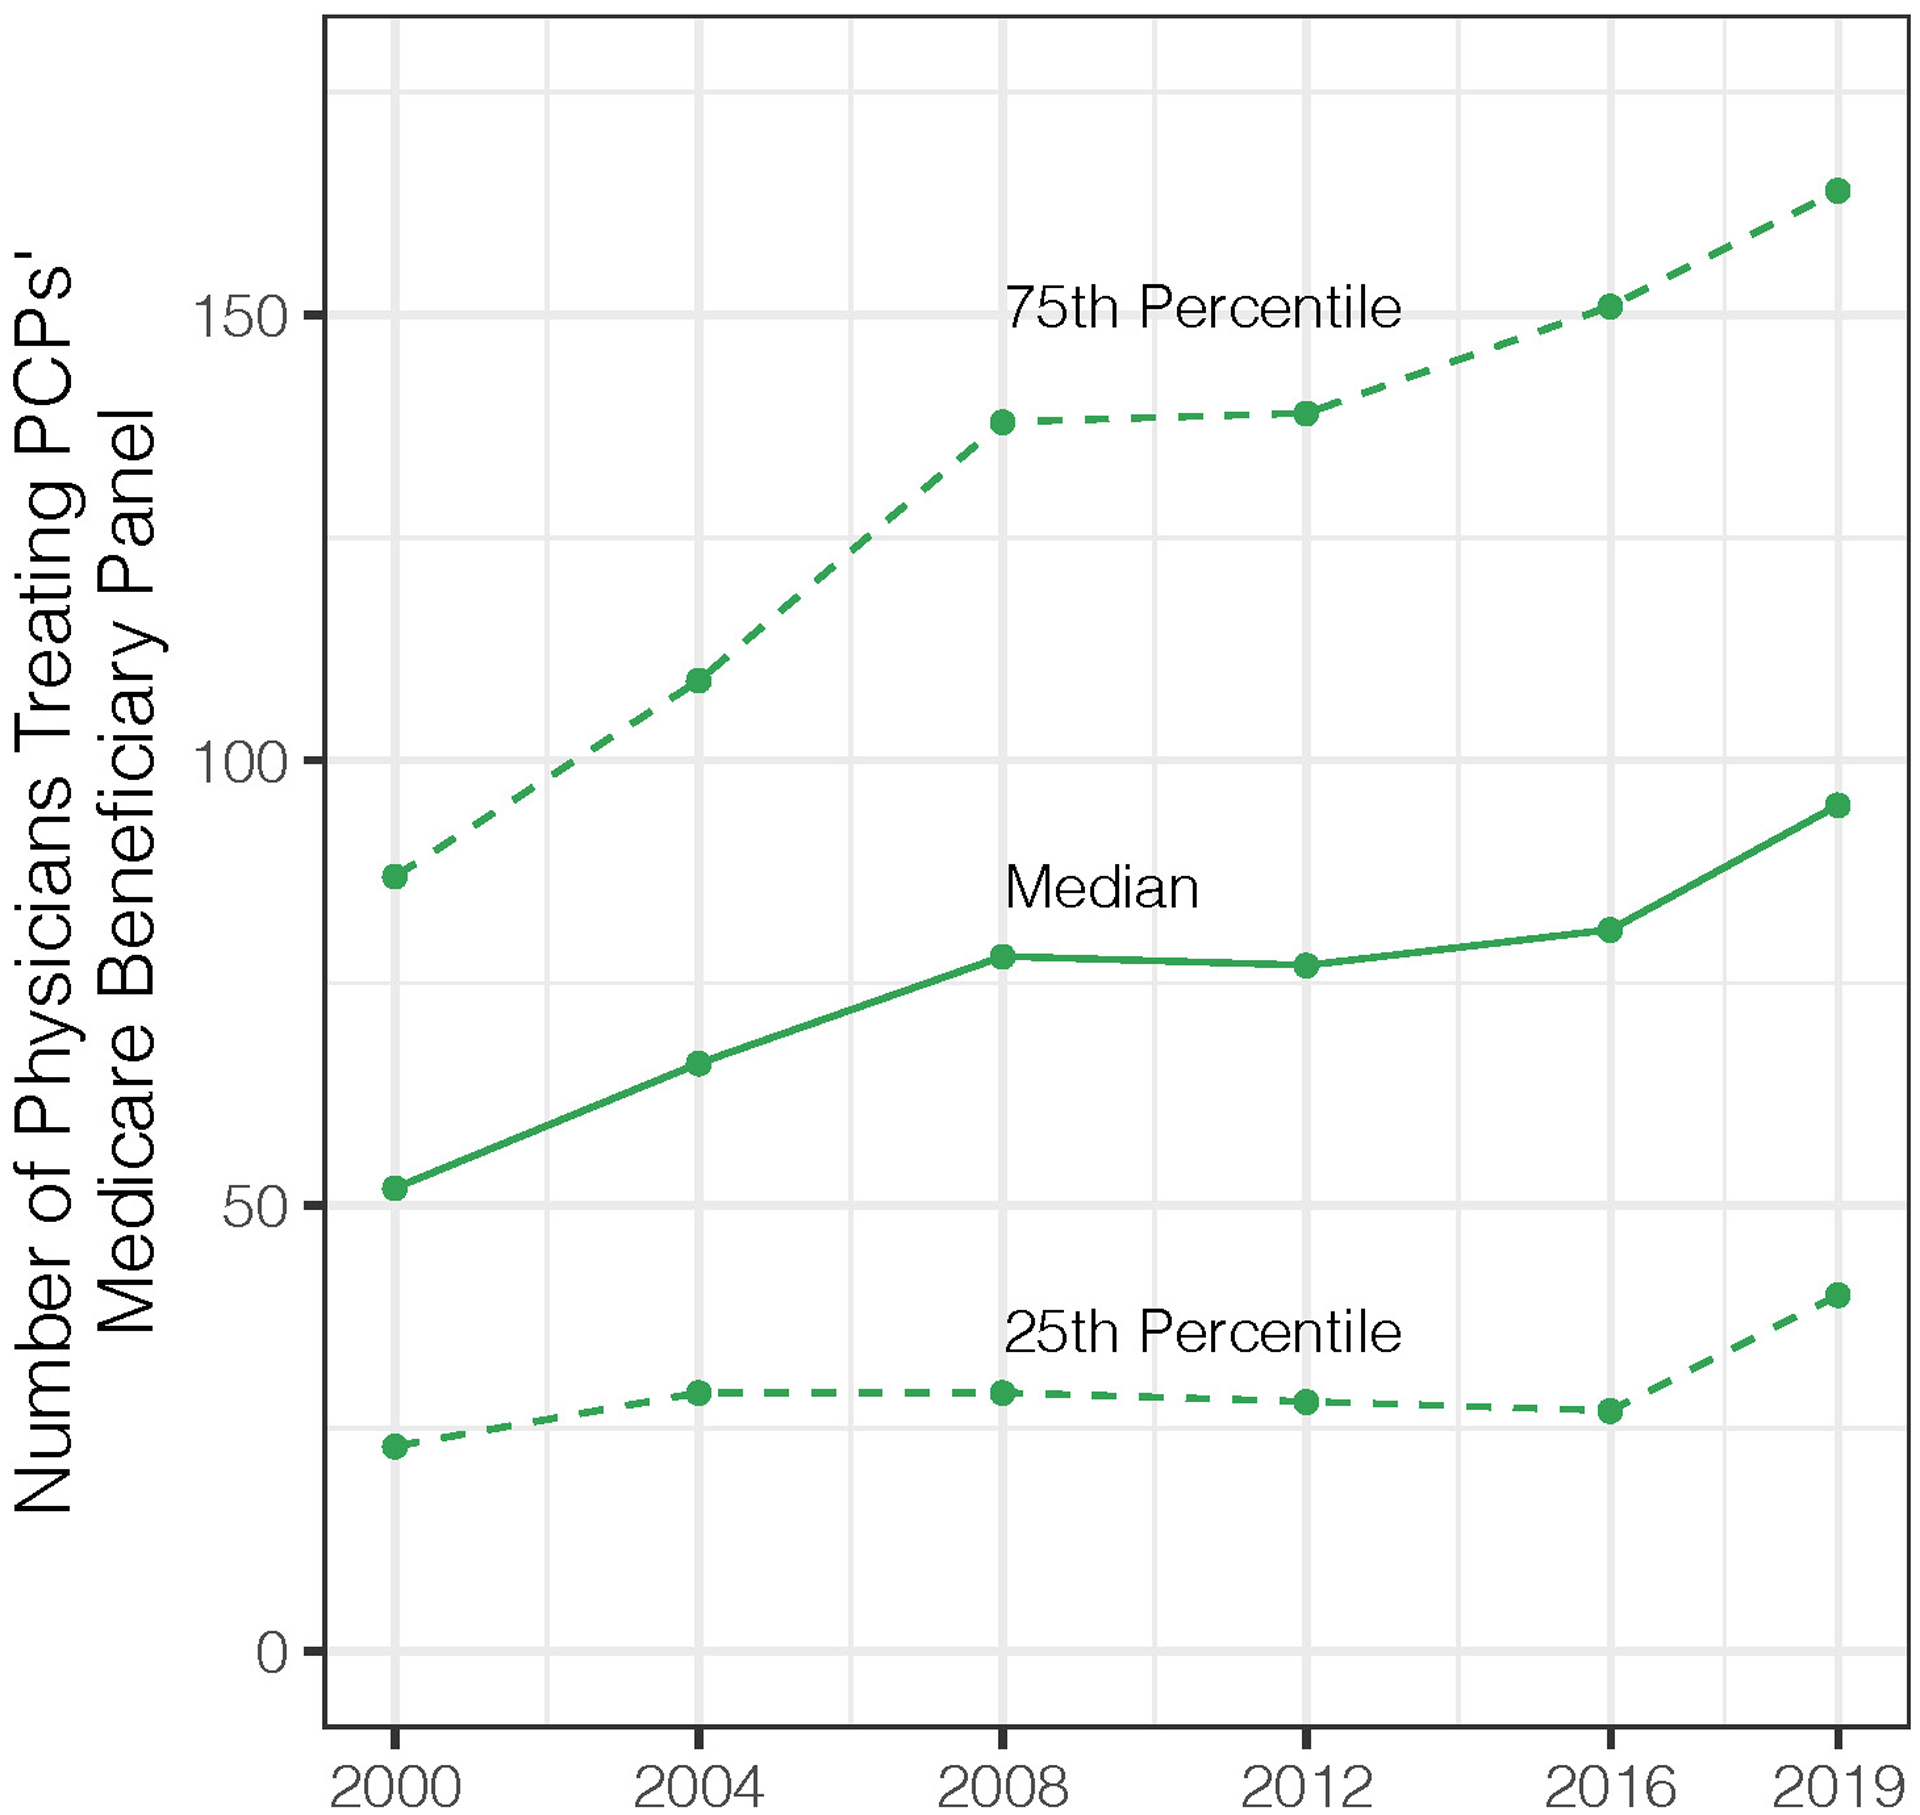
Figure 3: Trends in Number of Physicians Treating a PCP’s Panel of Medicare Beneficiaries, 2000–2019.

Panels A (line graph) and B (bar chart) show trends in the number of physicians treating a PCPs’ Medicare panel from 2000–2019, the median and inter-quartile range (25th and 75th percentile). The bar chart is shown to illustrate the final difference over the 20-year period. The number of other physicians seen by a PCP’s assigned Medicare patients is calculated by taking the number of other physicians seen annually (i.e. billing an evaluation and management visit or procedure) by all beneficiaries assigned to each PCP. Because our study population is limited to a 20% sample of Medicare beneficiaries, our measure may underestimate the absolute number of other physicians that would be calculated using data on 100% of a physician’s panel. However, analysis of network sampling for physician patient-sharing networks has found that 20% samples can reliably identify this value in claims data.(28)
