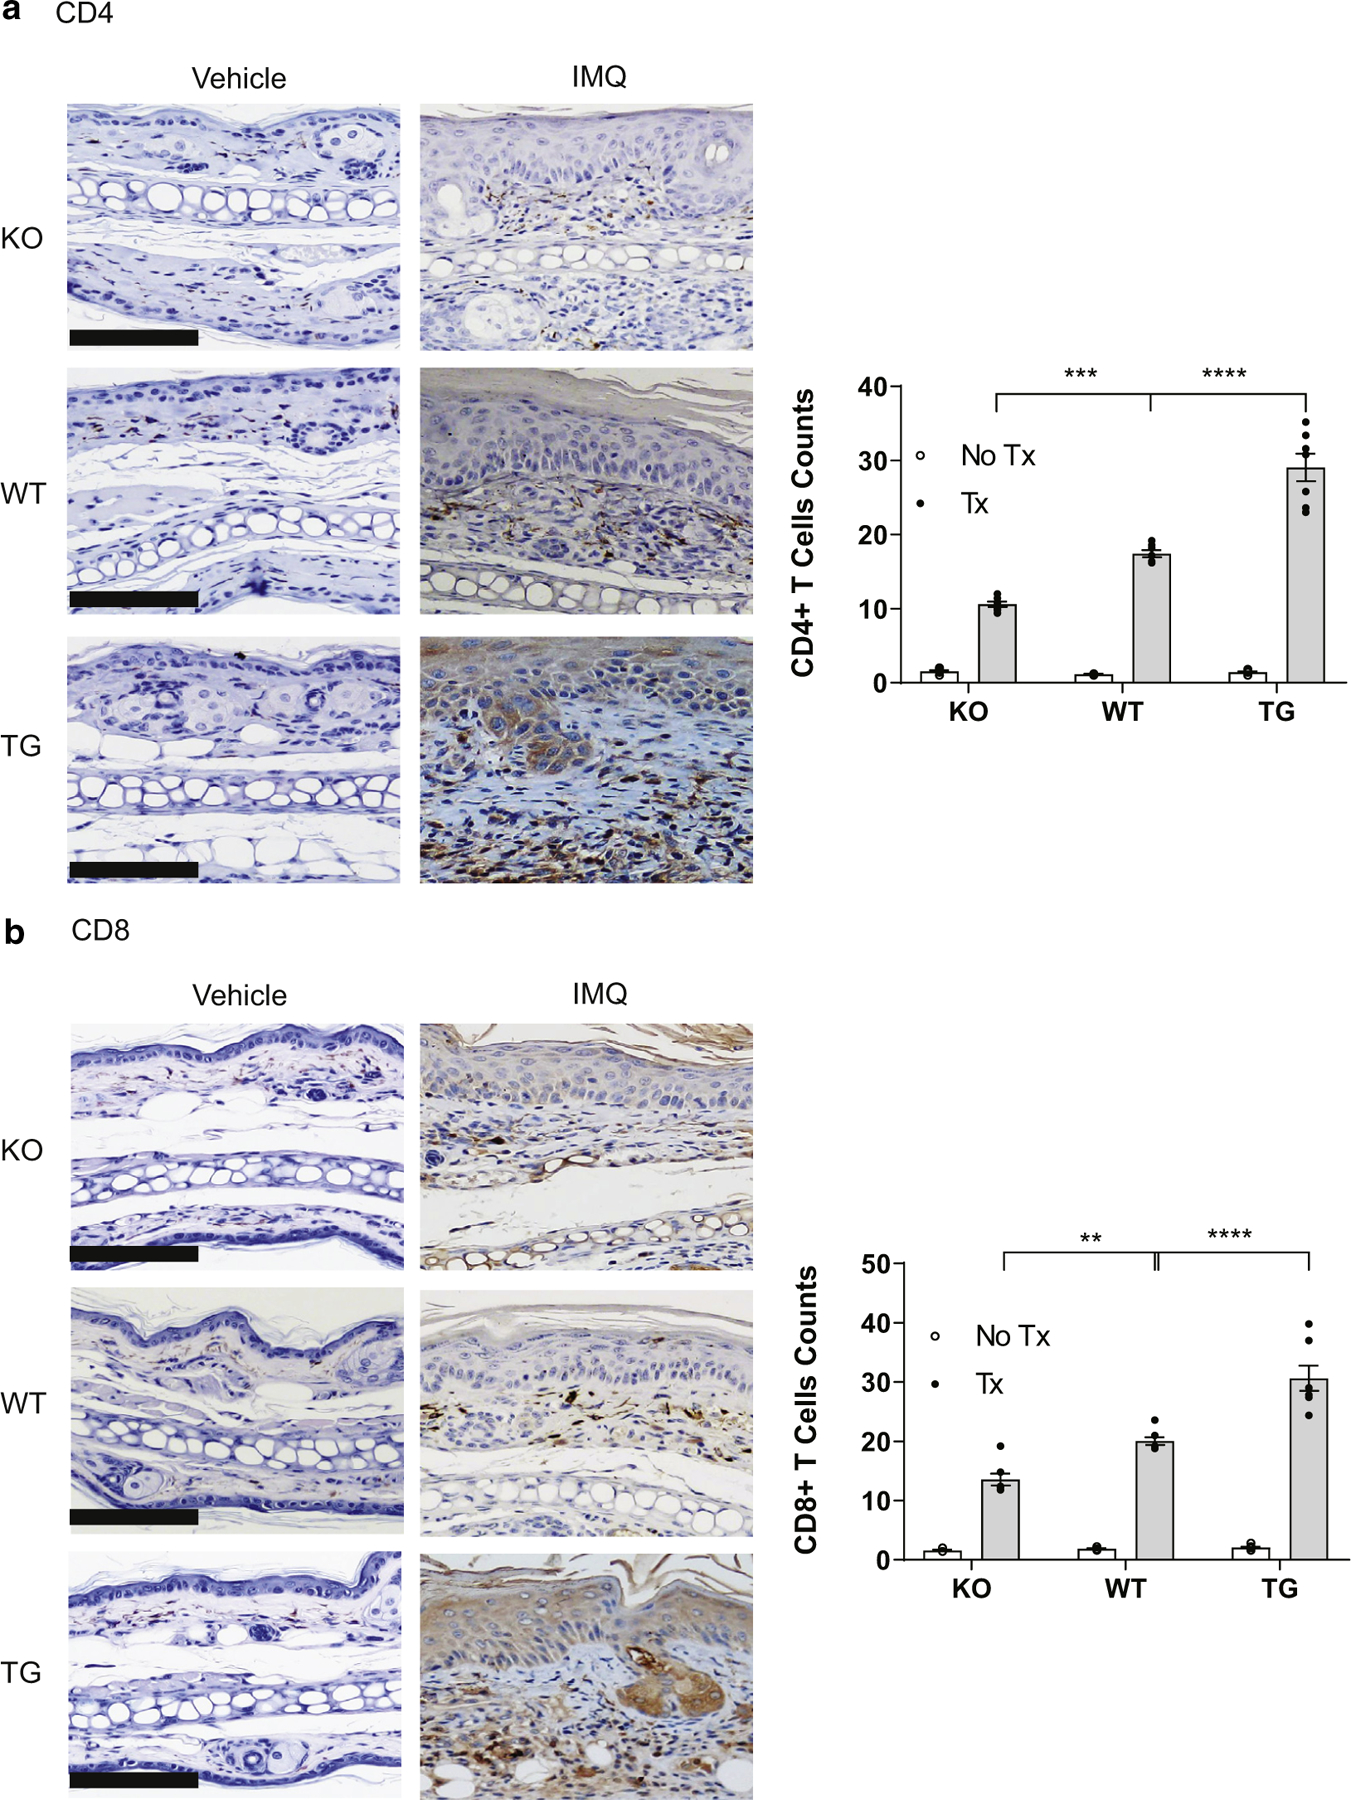
Figure 6. IFN-κ drives T-cell recruitment to psoriatic lesions.

(a) Representative images of KO, WT, and TG mice treated with IMQ stained for (a) CD4 and (b) CD8. Left panels show representative images; right panel shows the quantification of (a) CD4- and (b) CD8-positive cells per ×20 field from images examined across the entire section from five mice in each treatment and genotype group. Bar = 50 μm. Bar = 50 μm. IMQ, imiquimod; KO, knockout; TG, transgenic; Tx, treatment; WT, wild type.
