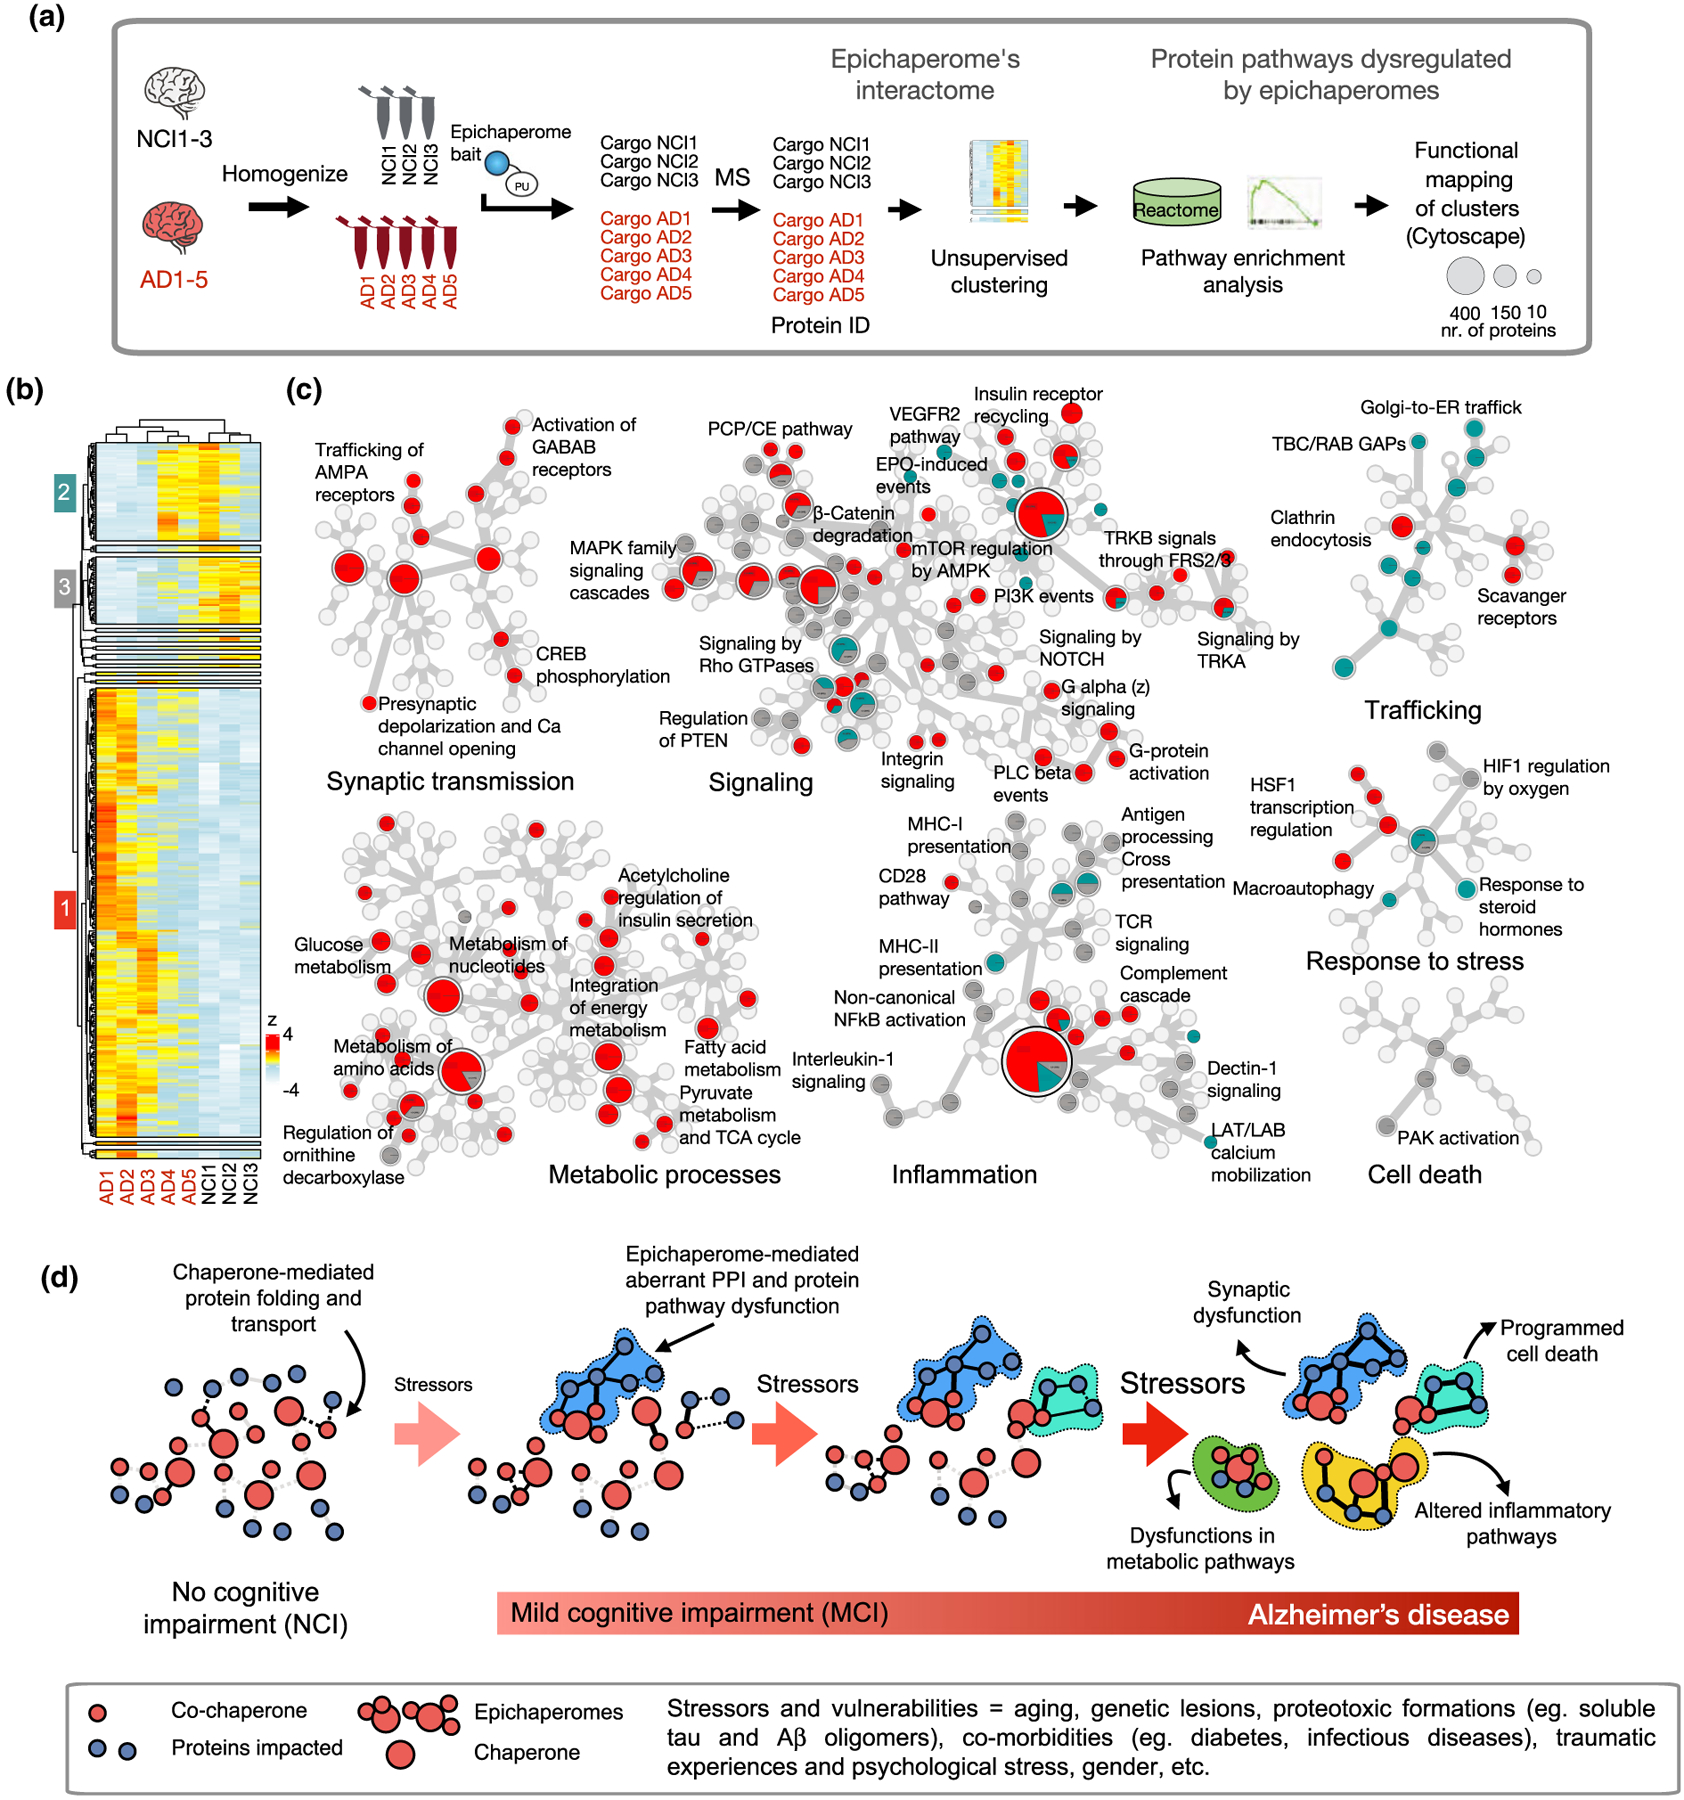
FIGURE 2.

Stressor-to-phenotype assessments via epichaperomics, the omics method that uses epichaperomes to identify and study aberrant PPIs in disease. (a) Schematic showing epichaperomics sample analysis and data processing. (b) Unsupervised clustering of datasets from Inda et al. (2020). Human brains (sporadic late-onset AD, n = 5 vs NCI = 3). (c) Reactome mapping of proteins in each of the three major clusters. In the Reactome map, generated in Cytoscape, each circle represents a function (i.e., a protein pathway). If the circle is divided among gray, red, and teal, it means the dysfunction in the particular protein pathway is characteristic of each cluster. (d) Schematic showing how the accumulation of stressors during the disease spectrum can negatively impact PPI to cascade in impaired cellular activity, intra-cellular communication, brain region connectivity, ultimately leading to decline seen in these disorders, such as AD. Abbreviations: AD, Alzheimer’s disease; NCI, no cognitive impairment
