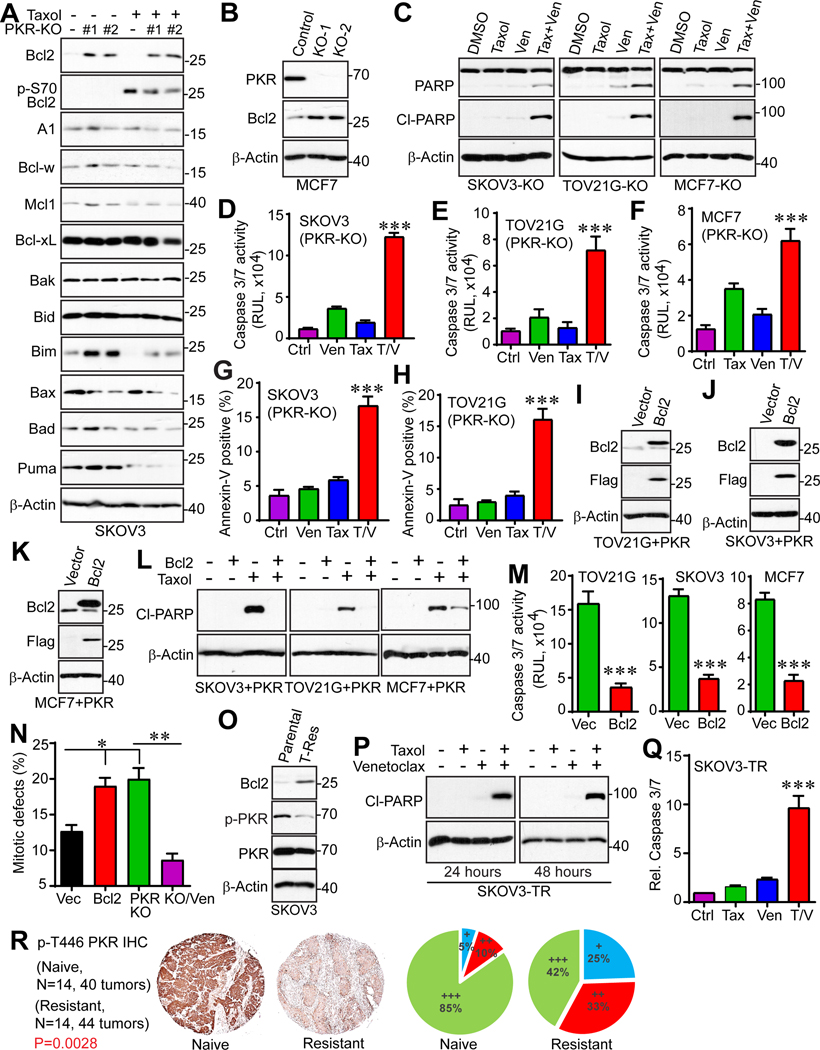
Figure 6. PKR regulates paclitaxel sensitivity through Bcl2.
(A) Expression of apoptosis regulators in SKOV3 parental and SKOV3-PKR-KO cell lines. Cells were treated with Taxol (100 nM) for 24 h and total cell lysates were probed with the indicated antibodies.
(B) Bcl2 expression is increased in MCF7-PKR-KO cells compared with control cells.
(C-H) Bcl2 inhibition reverses Taxol resistance in SKOV3-PKR-KO, TOV21G-PKR-KO, and MCF7-PKR-KO cells. Cells were treated with DMSO (control), Bcl2 inhibitor venetoclax (Ven, 10 μM), Taxol (100 nM) or the combination for 24 h. Apoptosis was determined by cleaved-PARP on Western blots (C). Cell apoptosis was also determined by measuring the caspase3/7 activity (D-F) and flow cytometry-based Annexin-V positivity (G, H).
(I-K) Establishment of cell lines with enhanced expression of both PKR and Bcl2. TOV21G, SKOV3, and MCF7 cells with PKR-overexpression (TOV21G+PKR, SKOV3+PKR, and MCF7+PKR) were established first and were then used for ectopic expression of Bcl2.
(L, M) Enhanced expression of Bcl2 confers resistance to Taxol. Cell lines established in H-J were treated with Taxol (100 nM) for 24 h and apoptosis was determined by cleaved-PARP expression (L) and caspase 3/7 activities (M).
(N) Overexpression of Bcl2 results in mitotic defects SKOV3 cells. Data were collected from 150 mitotic cells for each group (mean ± SD of three independent experiments). *: p<0.05; **: p<0.01 (unpaired Student’s t test).
(O) Expression levels of PKR and Bcl2 in parental and Taxol-resistant (TR) SKOV3 cells.
(P, Q) SKOV3-TR cells were treated with Taxol (250 nM) for 24 h or 48 h and apoptosis was determined by cleaved-PARP expression (P) and caspase 3/7 activities (Q).
(R) Phospho-PKR (autophosphorylation at T446, Abcam) levels is decreased in recurrent ovarian tumors. IHC staining with phospho-PKR on ovarian cancer tissue microarrays consisting of matched naïve and resistant tumors (39). Staining and scoring were done as we described (40). +: low expression; ++: moderate expression; +++: strong expression. P=0.0028 (Wilcoxon rank sum test). Data in panels D-H, M, and Q are expressed as mean ± SEM from three independent experiments. ***: p<0.001 (unpaired Student’s t-test).

