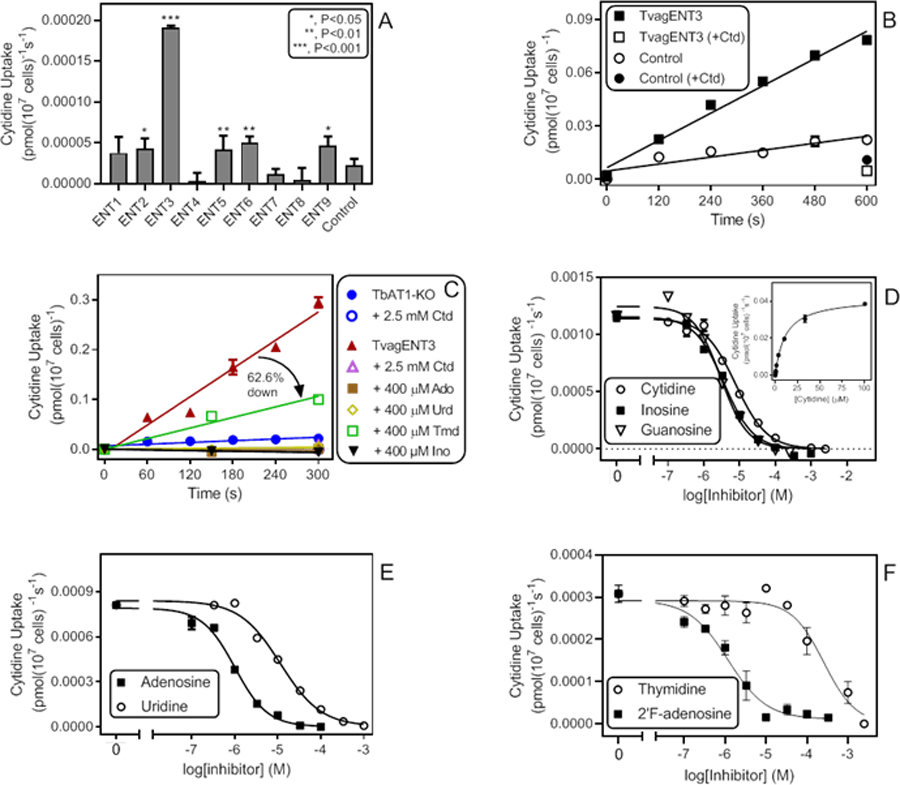
Figure 10.

Cytidine uptake in T. brucei expressing TvagENT3. A. Uptake of 0.5 µM [3H]-cytidine by T. brucei TbAT1-KO cells expressing one of the indicated TvagENT genes, as calculated from linear regression of uptake over 600 s with time points at 0, 180, 360 and 600 s. Bars represent average and SEM of the calculated slope. B. Uptake of 0.5 µM [3H]-cytidine by T. brucei TbAT1-KO cells expressing TvagENT3 over 600 s (r2 0.982, significantly non-zero P = 0.0001, not significantly non-linear P = 0.40). Control cells were T. brucei TbAT1-KO transfected with the empty vector r2 0.83, significantly non-zero P = 0.012, not significantly non-linear P = 0.90). [3H]-Cytidine uptake by either strain was strongly inhibited by the addition of 1 mM unlabelled cytidine (+Ctd). C. Transport of 0.5 µM [3H]-cytidine by T. brucei TbAT1-KO cells expressing TvagENT3. Control cells were T. brucei TbAT1-KO transfected with the empty vector. Transport of the uninhibited uptake (closed red triangles; r2 = 0.968, significantly different from zero P = 0.0004) was partly inhibited by 400 µM thymidine (62.6 %, significantly different from zero P = 0.0074) and completely inhibited by uridine, adenosine and inosine (not significantly different from zero, P > 0.15). D. Inhibition by cytidine, inosine and guanosine (Hill slopes −0.99, −1.07 and-1.15, respectively) of transport of 0.5 µM [3H]-cytidine over ** s. Inset: conversion of the cytidine inhibition data to a Michaelis-Menten saturation plot with Km 10.9 µM and Vmax 0.042 pmol(107 cells)−1s−1, r2 = 0.998. E. Inhibition by adenosine and uridine (Hill slopes −1.1 and −0.93, respectively), F. Inhibition by thymidine and 2’F-adenosine, with Hill slopes of −1.1 and-0.92, respectively.
