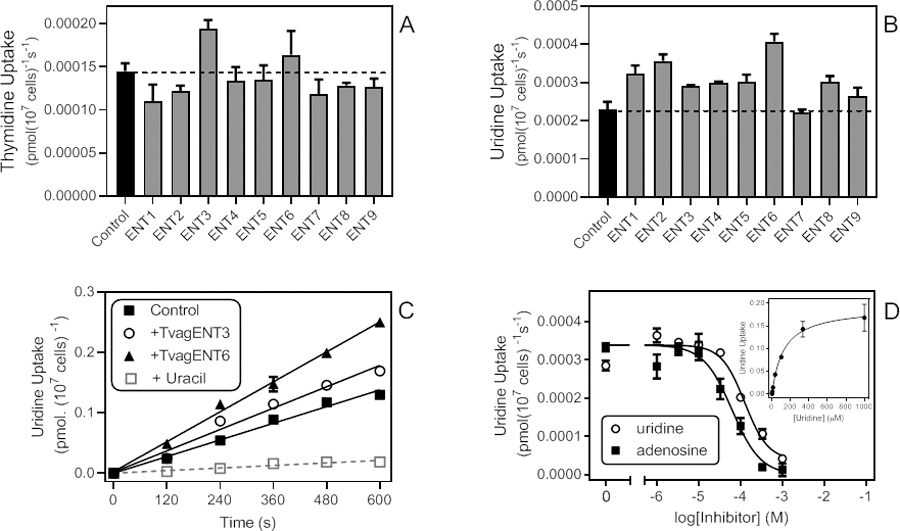
Figure 11.

Uptake of thymidine and uridine in T. brucei expressing TvagENTs. A. Uptake rates of 0.25 µM [3H]-thymidine, determined by linear regression of a time course over 300 s, for all nine TvagENTs. Bars show average and SEM of the slope. The dashed line indicates the level of uptake in control cells with empty vector pHD1336. B. Uptake rates of 0.25 µM [3H]-uridine; linear regression of a time course over 600 s, for all nine TvagENTs (measured at 0, 2, 4, 6, 8 and 10 min). C. Separate time course of 0.25 µM [3H]-uridine uptake by three cell lines, highlighting the high background uptake in the control (empty vector) cells. This was reduced by 84.7% in the presence of 250 µM uracil (P < 0.0001). Uptake by cells expressing TvagENT3 and TvagENT6 was significantly higher than empty vector control (P = 0.0332 and P<0.0001, respectively). D. Dose-response curves for inhibition of uptake of 0.5 µM [3H]-uridine over 240 s, by adenosine (r2 = 0.972) and uridine (r2 = 0.972). Inset: conversion of the uridine inhibition data to a Michaelis-Menten saturation curve, showing Km,app = 125.4 µM for this experiment.
