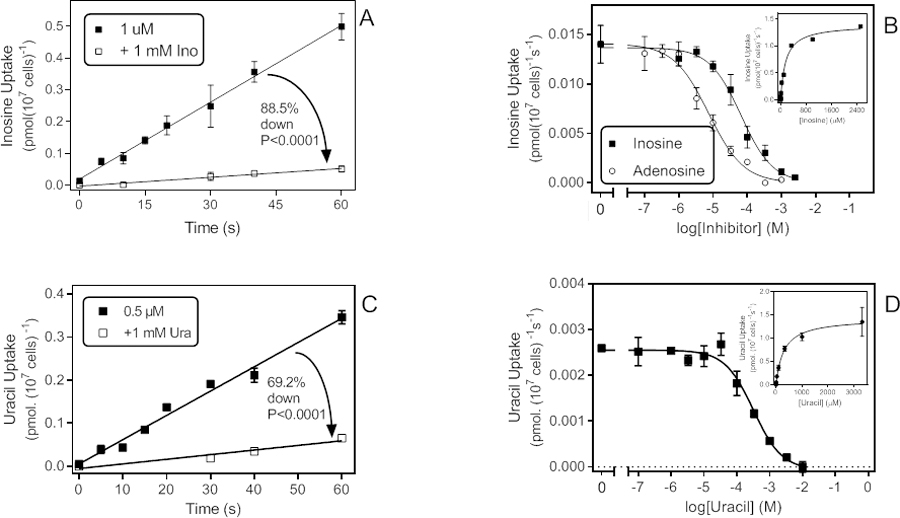
Figure 5.

Low affinity uptake of some purine and pyrimidine substrates. A. Time course of 1 µM [3H]-inosine transport in the presence and absence of 1 mM unlabelled inosine. Rate was 0.0081 ± 0.0002 pmol(107 cells)−1s−1 in the absence of unlabelled permeant (r2 = 0.99; not significantly non-linear P = 0.97, significantly different from zero P < 0.0001); in the presence of 1 mM unlabelled inosine the rate was 0.00092 ± 0.00009 pmol(107 cells)−1s−1 (r2 =0.97; not significantly non-linear, P=0.90; significantly different from zero, P = 0.0018). The two slopes were significantly different (F-test, P<0001). B. Dose-dependent inhibition of 1 µM [3H]-inosine uptake by unlabelled inosine or adenosine. Inosine: EC50 = 67.1 µM, Hill slope −0.93, r2 = 0.99; Adenosine: EC50 = 74.8 µM, Hill slope −0.85, r2 = 0.99. Inset: conversion of the inosine inhibition data to a Michaelis-Menten saturation curve, Km,app = 157 µM, r2 = 0.99. C. Time course for the uptake of 0.5 µM [3H]-uracil, with rate 0.0056 ± 0.0003 pmol(107 cells)−1s−1 (r2 =0.98; not significantly non-linear, P=0.89; significantly different from zero, P < 0.0001). In the presence of 1 mM unlabelled uracil, the rate was reduced by 81% to 0.0011 ± 0.0002 pmol(107 cells)−1s−1 (r2 =0.94; not significantly non-linear, P=0.67; significantly different from zero, P < 0.031). D. Dose-dependent uptake of 0.5 µM [3H]-uracil over 20 s; EC50 = 247 µM, r2 0.97 in this experiment. Inset: conversion to Michaelis-Menten saturation plot, Km = 298 µM, Vmax = 1.43 pmol(107 cells)−1s−1, r2 = 0.997.
