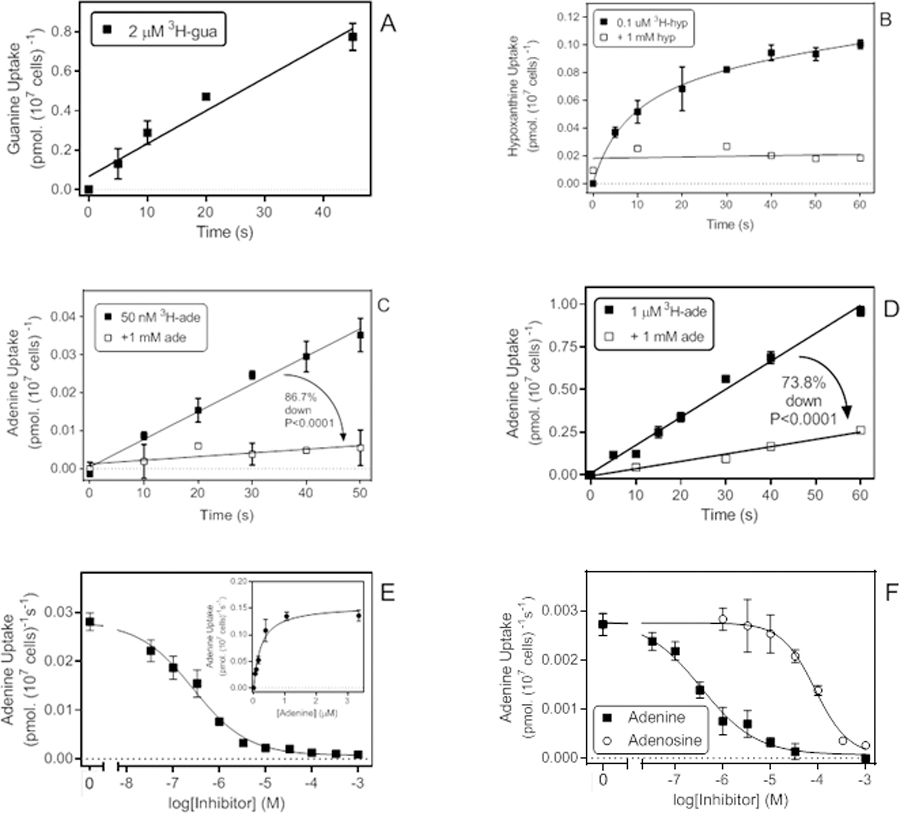
Figure 6.

Transport of purine nucleobases. A. Uptake of 2 µM [3H]-guanine with a rate of 0.0167 ± 0.0020 pmol(107 cells)−1s−1 (r2 =0.96; not significantly non-linear, P = 0.50; significantly different from zero, P = 0.0035). B. Uptake of 0.1 µM [3H]-hypoxanthine was non-linear and instead plotted to a curve for saturation binding. In the presence of 1 mM unlabelled hypoxanthine linear regression was applied and yielded a slope that was not significantly different from zero (P=0.74). C. Transport of 50 nM [3H]-adenine in the presence and absence of 1 mM unlabelled adenine, yielding rates of 0.00073 and 0.000097 pmol(107 cells)−1s−1, respectively (P < 0.0001). In the absence of 1 mM adenine the rate was significantly non-zero (P < 0.0001) but in the presence of saturating adenine it was not (P = 0.064). D. Transport of 1 µM [3H]-adenine in the presence and absence of 1 mM unlabelled adenine, yielding rates of 0.0164 and 0.00429 pmol(107 cells)−1s−1, respectively (P < 0.0001). Both rates were significantly non-zero (P < 0.0001 and P = 0.0016, respectively), the regression lines not significantly non-linear, and r2 values were 0.989 and 0.976, respectively. E. Inhibition of [3H]-adenine uptake by unlabelled adenine. EC50 was 0.27 µM for this experiment, Hill slope was −0.74, r2 = 0.992. Inset: conversion to a Michaelis-Menten saturation plot, yielding a Km,app of 0.23 µM and Vmax of 0.155 pmol(107 cells)−1s−1, r2 = 0.979. F. inhibition of 50 nM [3H]-adenine transport by unlabelled adenine (EC50 = 0.35 µM, Hill slope −0.75, r2 = 0.987) and adenosine (EC50 = 85.9 µM, Hill slope −1.23, r2 = 0.994). When plotted to a two transporter model the adenine inhibition curve exhibited a high affinity EC50 of 0.23 µM (81% of flux) and a lower affinity component of 17 µM, but the latter had a large degree of uncertainty.
