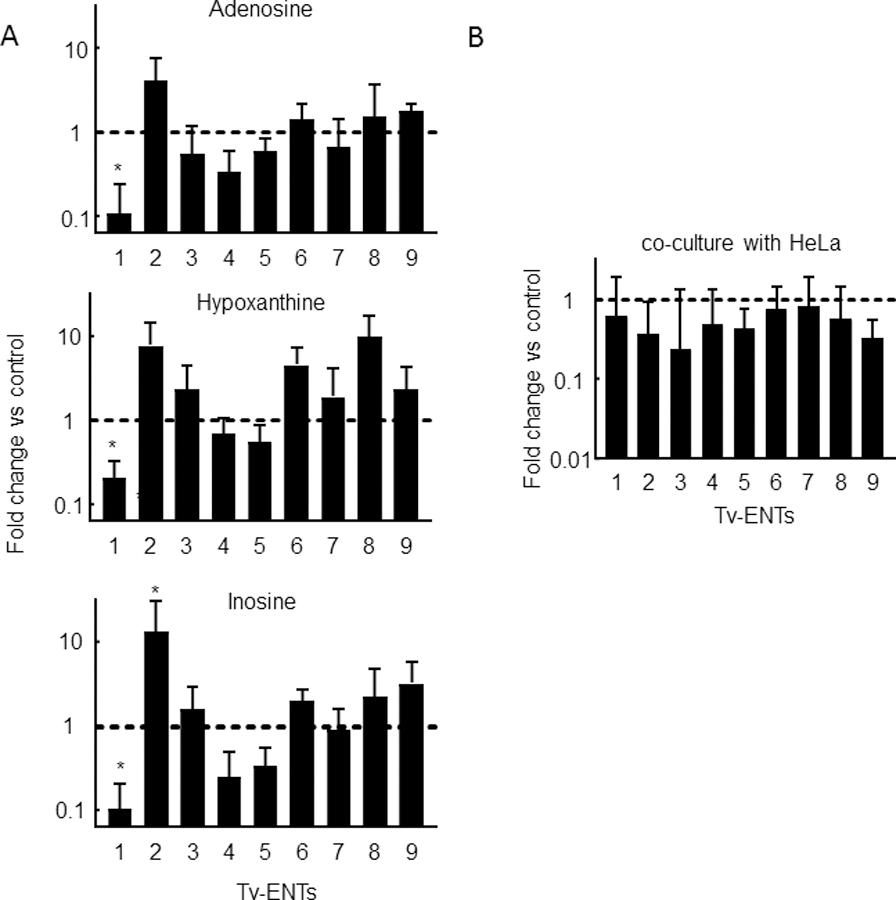
Figure 9.

Impact of culture conditions on T. vaginalis ENT expression patterns. A. T. vaginalis G3 trophozoites were incubated with or without (control) the indicated nucleosides (100 µM) overnight. RNA was extracted and analyzed by quantitative PCR for ENT expression. B. T. vaginalis G3 were incubated with (experimental) or without (control) HeLa cells in 6 well plates with 25% TYM and 75 % DMEM for 6 hours. RNA was extracted and analyzed by qPCR. Ct values were standardized by GAPDH and expression levels were normalized to controls. Bars represent the means and SEM of 3–4 independent experiments; *p<0.05 vs control condition by ANOVA and Dunnett’s post-hoc.
