. 2021 Dec 9;63(1):42–55. doi: 10.3349/ymj.2022.63.1.42

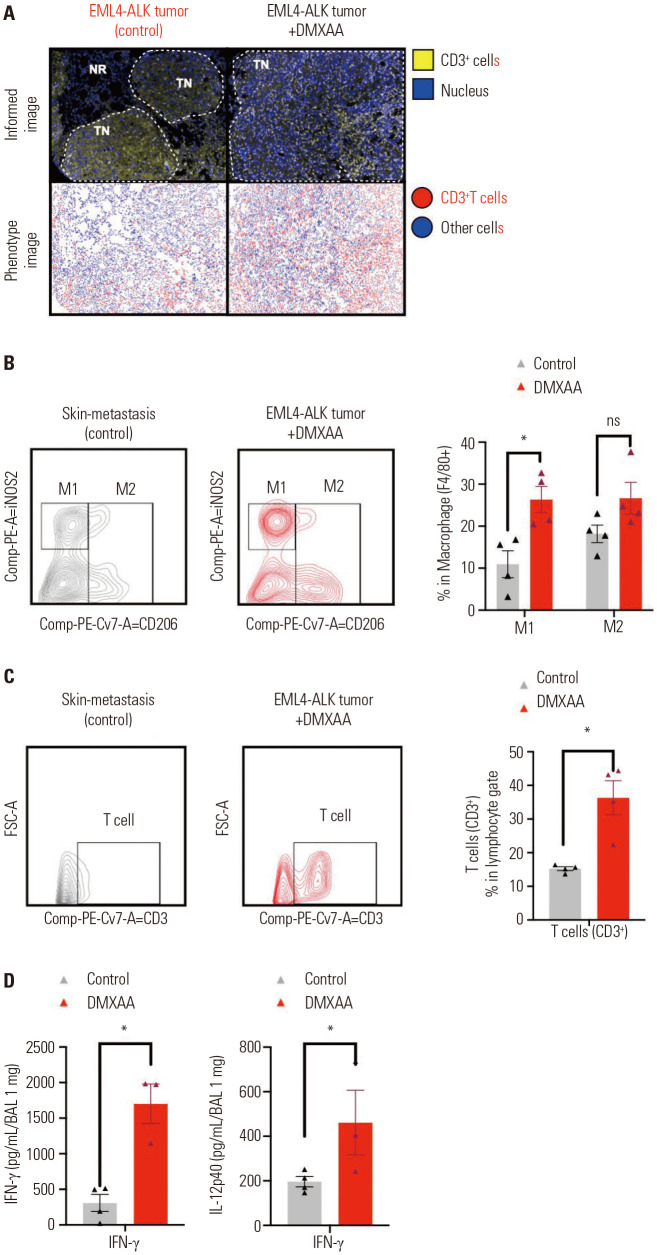
Fig. 2. DMXAA treatment enhanced the infiltration of CD3+ T cells and macrophages in the tumor. (A) Representative IHC and phenotype images of the control and DMXAA-treated tumor-bearing mice. T cells are marked as yellow (upper) or red (lower). (B) Flow cytometry analysis of the macrophages and (C) T cells. The gating strategy is shown in the left panel; the numbers of M1, M2, and T cells of treatment group were higher than those in the control group. The percentages of M1, M2, and T cells are presented in a bar graph (right panel). (D) The IFN-γ and IL-12p40 concentrations in BAL fluid analyzed using an ELISA assay. The results are expressed as mean±SD. *p<0.05. ns, not significant; IFN, interferon; IL, interleukin; IHC, immunohistochemistry; BAL; Bronchoalveolar lavage; ELISA, enzyme-linked immunosorbent assay.

Fig. 2